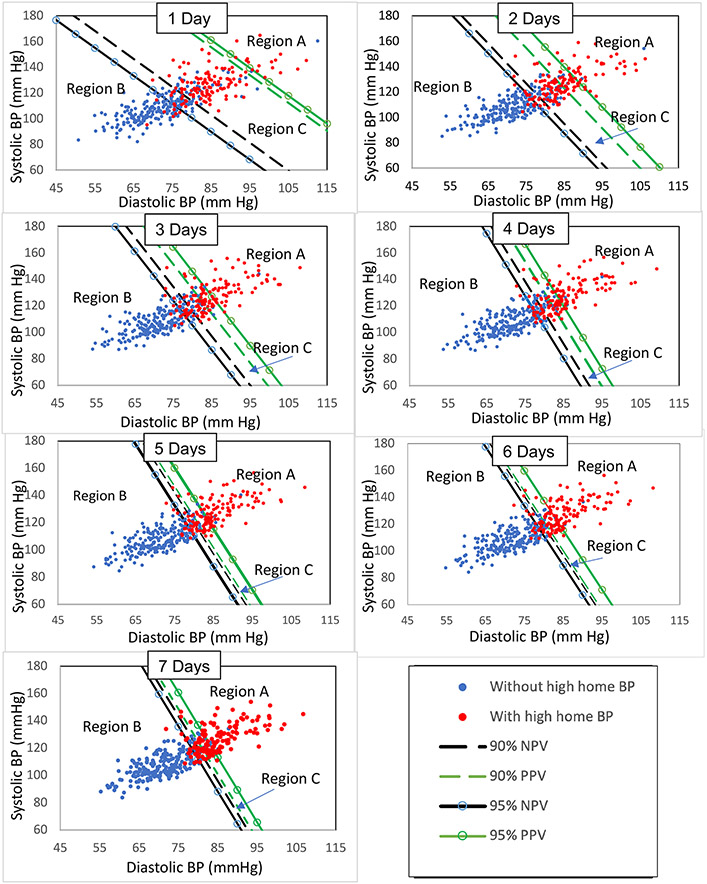
Figure 1. Scatter plots of home systolic and diastolic BP levels for 361 participants based on 1, 2, 3, 4, 5, 6, and 7 days of morning and evening readings from the sampling period.
Participants with high home BP based on the reference period appear as red circles while participants without high home BP are shown in blue. Region A contains combinations of systolic and diastolic BP levels with a high degree of confidence for having high home BP (greater than 90% PPV and greater than 95% PPV). Region B contains combinations systolic and diastolic BP levels with a high degree of confidence for not having high home BP (greater than 90% NPV and greater than 95% NPV). Region C represents the region of uncertainty.
BP: blood pressure; NPV: negative predictive value; PPV: positive predictive value

