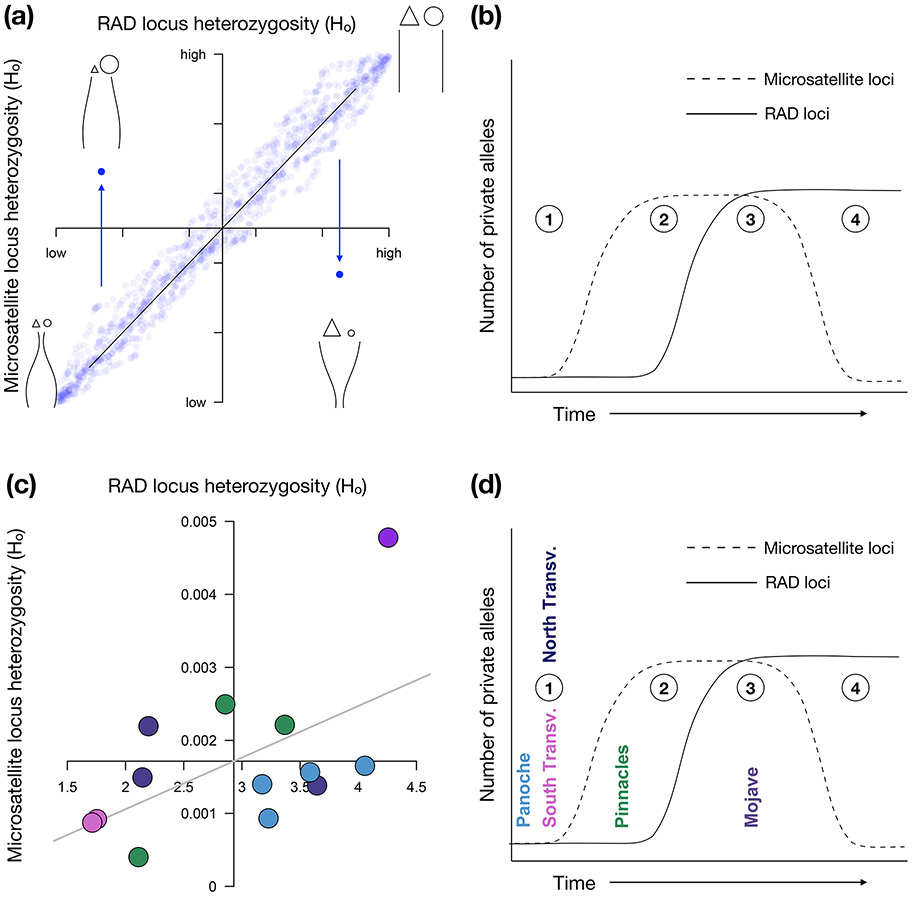
Figure 1. Predictions of genetic marker variation supporting different historical biogeographic scenarios.
(a) The concordance (or lack thereof) between values of observed heterozygosity (Ho) across RAD and microsatellite loci reflects different population histories (population size through time shown by curved lines in each quadrant, with time increasing towards the top). Most population histories will yield generally concordant levels of heterozygosity (blue points) across both marker types (lower left and upper right quadrants). Discordant heterozygosity values between the two marker types in which one marker is much higher than the other (lower right and upper left quadrants) suggest timing and strength of historical bottlenecks or founder events that will differentially affect these marker types. (b) The predictions from heterozygosity can be integrated with numbers and identity of private alleles across marker types to create a framework for testing among competing biogeographic hypotheses across populations (numbers in circles). Variation in correspondence between these values over time is due to the differential mutational and saturation properties of the two marker types. Recently isolated populations should have few private alleles at either marker type (1). Higher microsatellite mutation rates will generate microsatellite private alleles before RAD private alleles (2). Eventually private RAD alleles will occur (3), and finally random mutations in other populations could result in size homoplasy, rendering some microsatellite private alleles undetectable (4). (c) In our data, heterozygosity discordance shows two North Transverse populations in the upper left quadrant, showing signs of more recent bottlenecks, while Panoche populations occur in the lower right quadrant, indicating an older bottleneck followed by a population rebound. Axes are placed at mean heterozygosity values for each marker type, and the grey line represents the results from a linear regression of RAD heterozygosity agains microsatellite heterozygosity. (d) Discordance in private allele rates at our two marker types place the populations on a time-since-isolation axis. The Pinnacles populations show signatures of long-term isolation.

