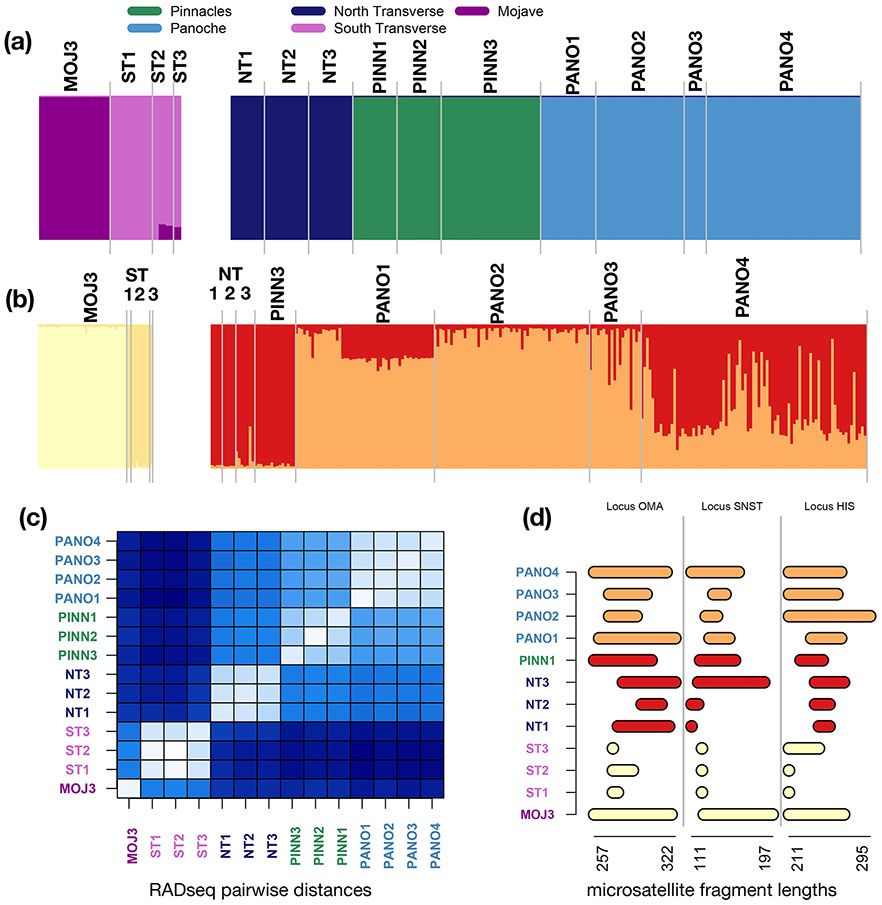
Figure 3. Structure demes and marker-specific patterns of diversity.
(a) RADseq Structure results for northern and southern population groups (b) Microsatellite Structure results. While patterns are broadly congruent, microsatellites distinguish the smaller populations in the Panoche region (PANO1-3) from the other populations in the northern region. (c) Average pairwise number of SNP differences between each pair of individuals in each population. This measure recapitulates the Structure demes. The three South Transverse populations are the most distinct from any other regional deme (dark bands), while the two larger Pinnacles (PINN2 and PINN3) populations are the most similar to every other group (lighter bands). (d) Range between the largest and smallest allele in each population for three microsatellite loci. Populations are colored by their RADseq structure deme. North and South Transverse populations are observably different in allele size range, while allele size range seems to shift more smoothly between the north Transverse, Pinnacles, and Panoche regions.

