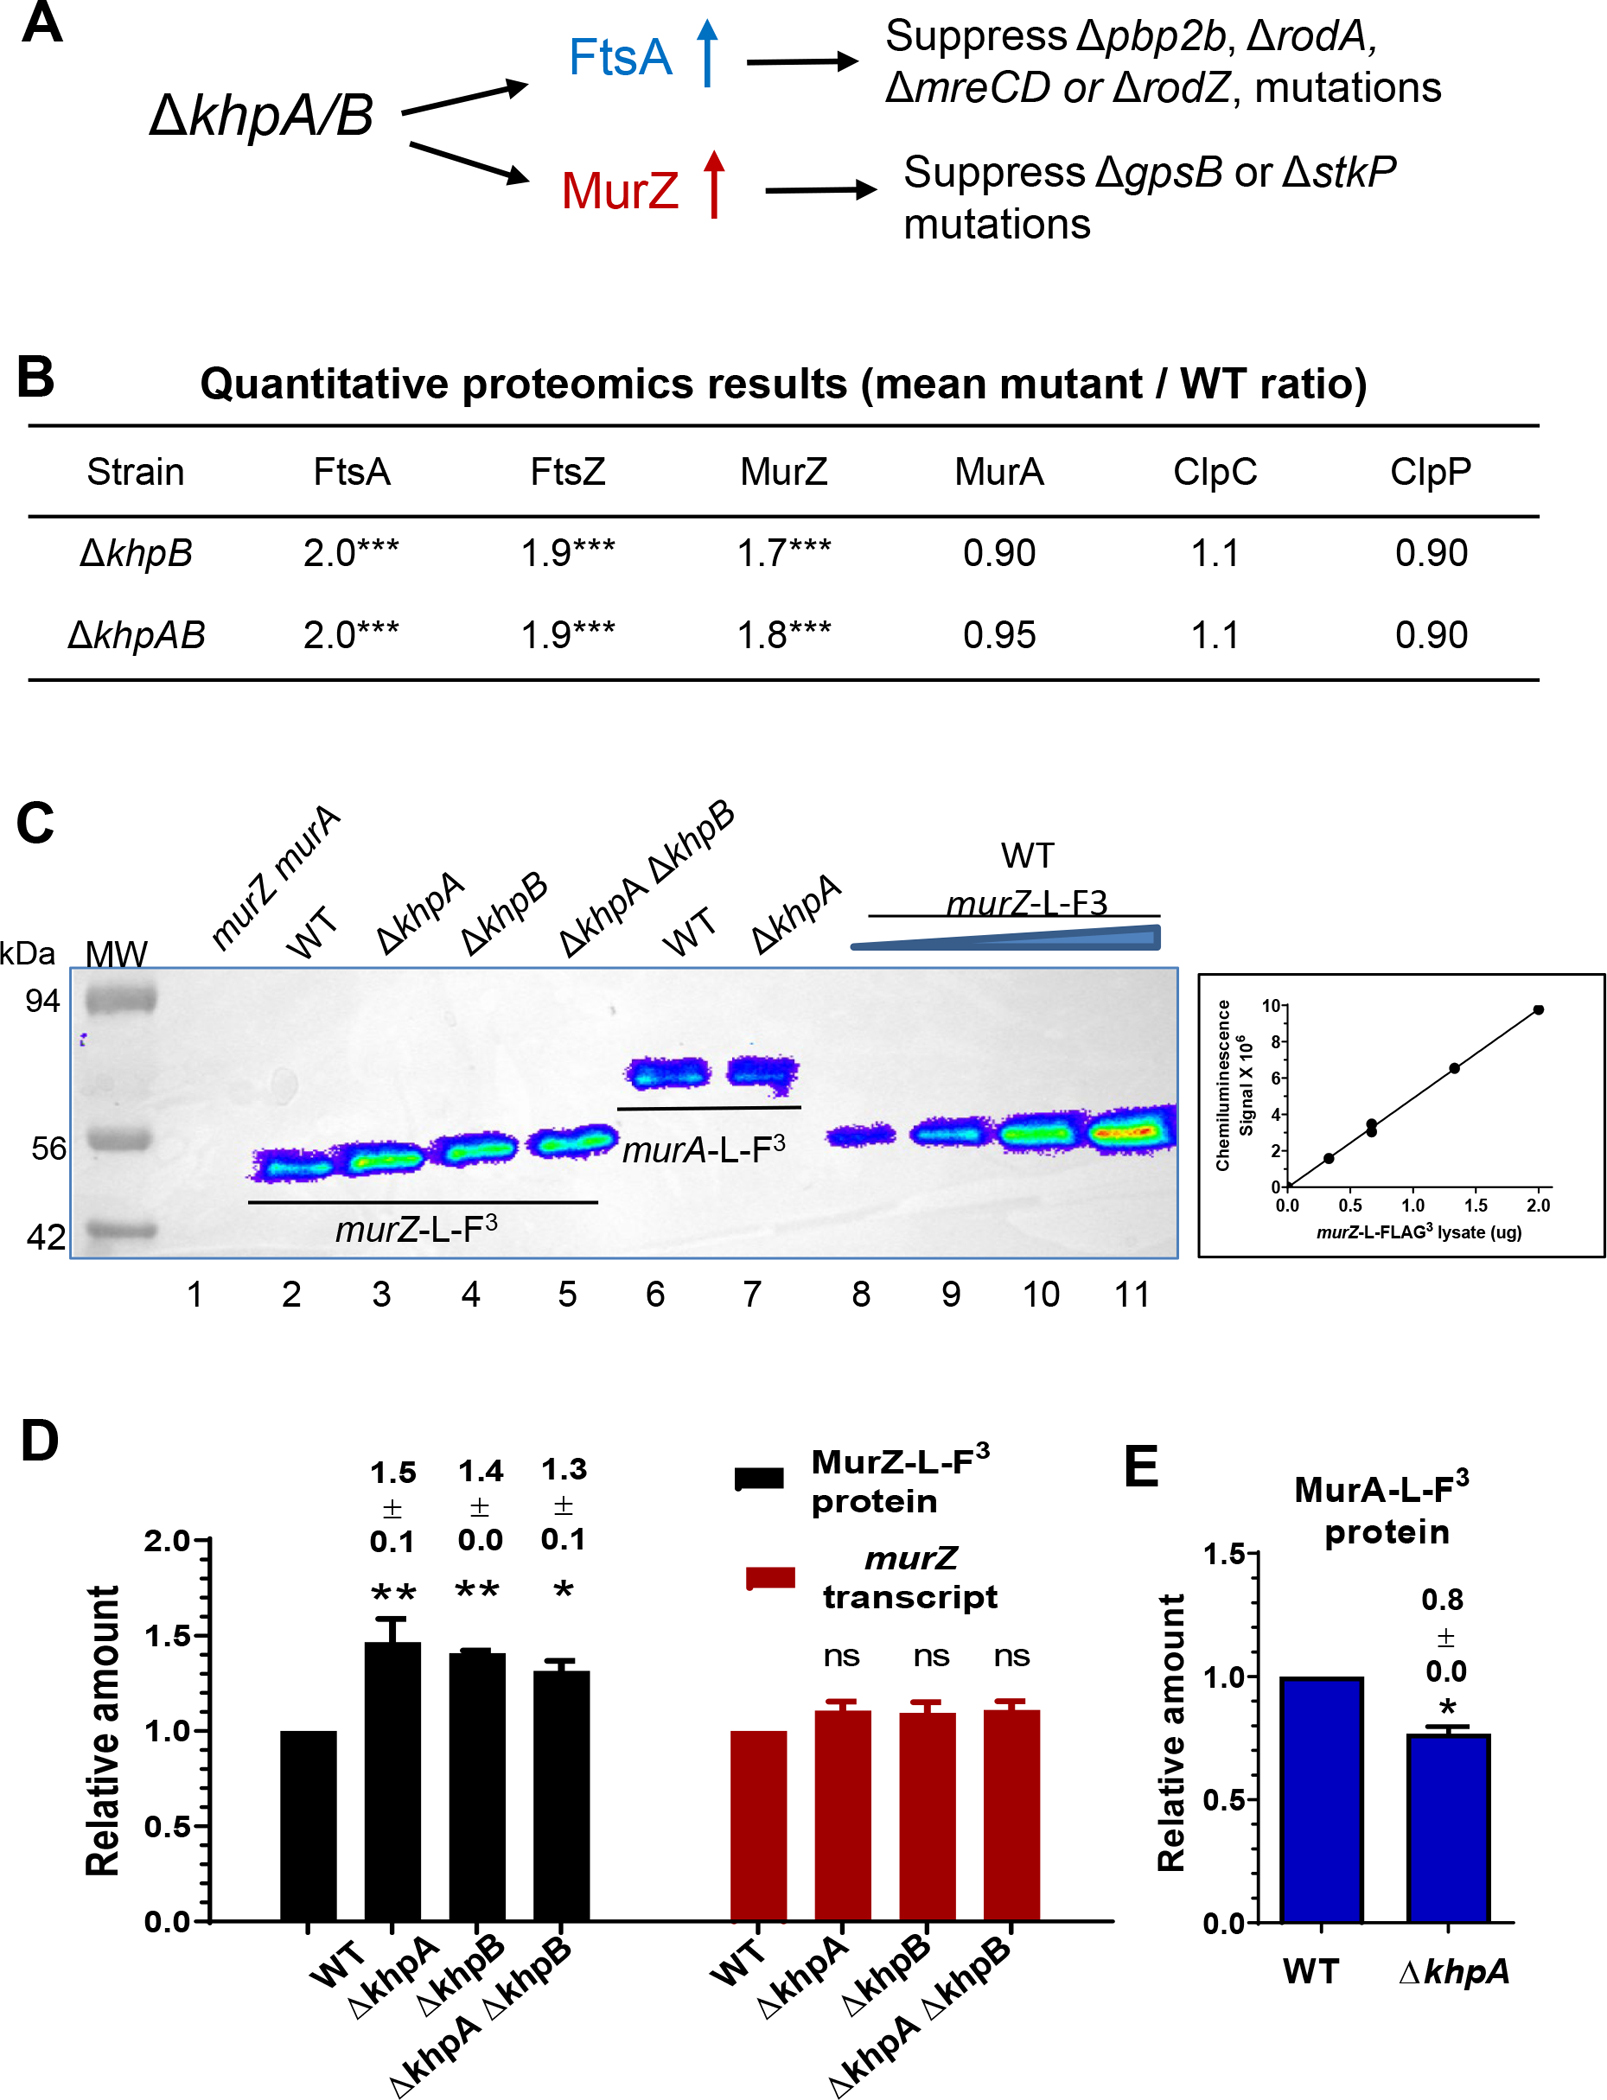
Figure 11. KhpA/B negatively and post-transcriptionally regulates MurZ(Spn), but not MurA(Spn), cellular amounts.

(A) Summary of suppression patterns of ΔgpsB, Δpbp2b, ΔrodA, and ΔmreCD by ΔkhpA/B mutation. The absence of KhpA and/or KhpB increases the cellular amount of FtsA, which bypasses the requirement for essential PBP2b, RodA, RodZ, and MreCD (Lamanna et al., 2022, Zheng et al., 2017). The absence of KhpA/B also moderately increases cellular MurZ amount as shown below, which bypasses the requirement for essential GpsB and StkP as described in the text and Fig. 12. (B) Quantitative proteomic results showing relative amounts of FtsA, FtsZ, MurZ, MurA, ClpC, and ClpP in ΔkhpA ΔkhpB (IU10596) or ΔkhpB (IU10592) strains compared to wild-type (IU1824). *** p < 0.001. Proteomics was performed as described in Experimental procedures, and data are contained in Appendix A, Tab E. (C) Representative Western blots using anti-FLAG antibody to determine the cellular amounts of MurZ-L-FLAG3 and MurA-L-FLAG3 in cells growing exponentially in BHI broth. Lane 1, WT parent (IU1824); lane 2, murZ-L-F3 (IU13502); lane 3, murZ-L-F3 ΔkhpA (IU13545); lane 4, murZ-L-F3 ΔkhpB (IU14014); lane 5, murZ-L-F3 ΔkhpA ΔkhpB (IU14016); lane 6, murA-L-F3 (IU14028); lane 7, murA-L-F3 ΔkhpA (IU14030). 0.67 μg of total protein from each strain were loaded in lanes 1–7. For lanes 8 to 11, 0.33, 0.67, 1.33, and 2 μg, respectively, of murZ-L-FLAG3 (IU13502) lysates were loaded to generate the standard curve at right, which showed proportionality between protein amounts and signal intensities over the range of signal intensities obtained. (C) Relative average (± SEM) of cellular amounts of MurZ-L-F3 or murZ transcripts in mutants compared to WT from 3 independent experiments. P values were obtained relative to WT by one-way ANOVA analysis (Dunnett’s multiple comparison test, GraphPad Prism). * P<0.05; ** P<0.01; ns: not significantly different. (E) Relative average (± SEM) cellular amount of MurA-L-F3 protein in a ΔkhpA mutant compared to WT from 3 independent experiments. P value was obtained relative to WT by one sample t-test (GraphPad Prism). * p<0.05.
