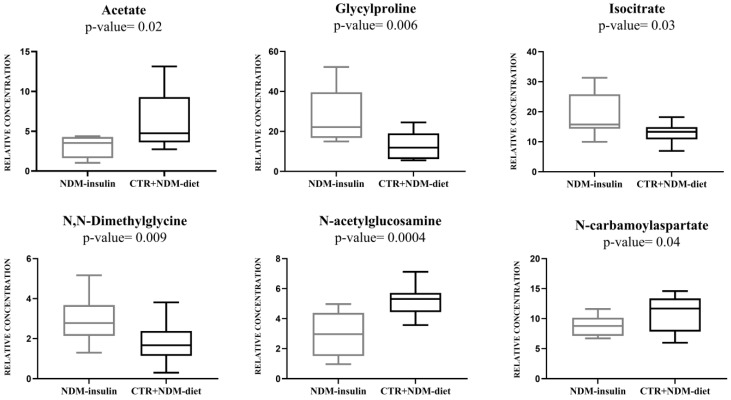
Figure 2.
Box-and-whisker plots of the relative levels of metabolites in CTR + NDM-diet and NDM-insulin groups measured by 1H NMR technique. The Mann–Whitney U test was utilized to establish statistical significance, with a significance level set at p-value < 0.05. Furthermore, the Benjamini–Hochberg adjustment was implemented.

