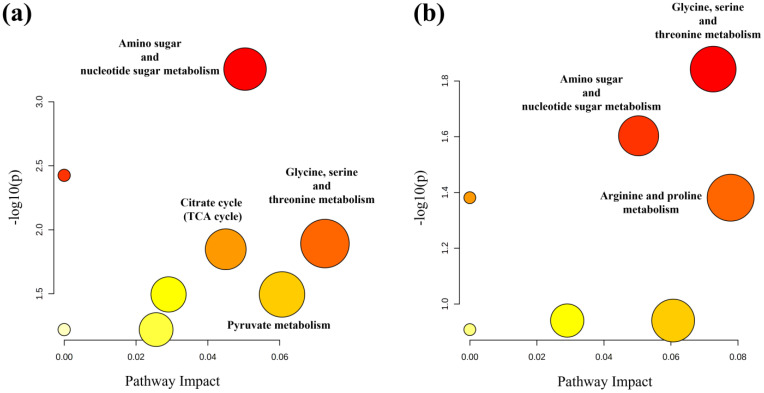
Figure 5.
Metabolic pathway analysis of the set of metabolites found statistically different between CTR + NDM-diet and NDM by 1H NMR (a) and GC-MS (b) analysis of urine samples taken at time T1. The plots were generated using MetaboAnalyst 5.0. On the X-axis, the impact of the identified metabolites on the specified pathway is represented, while the Y-axis indicates the level of enrichment of the designated pathway by the identified metabolites. The color of the circles signifies the significance of pathway enrichment, whereas the circle size indicates the impact on the pathway.

