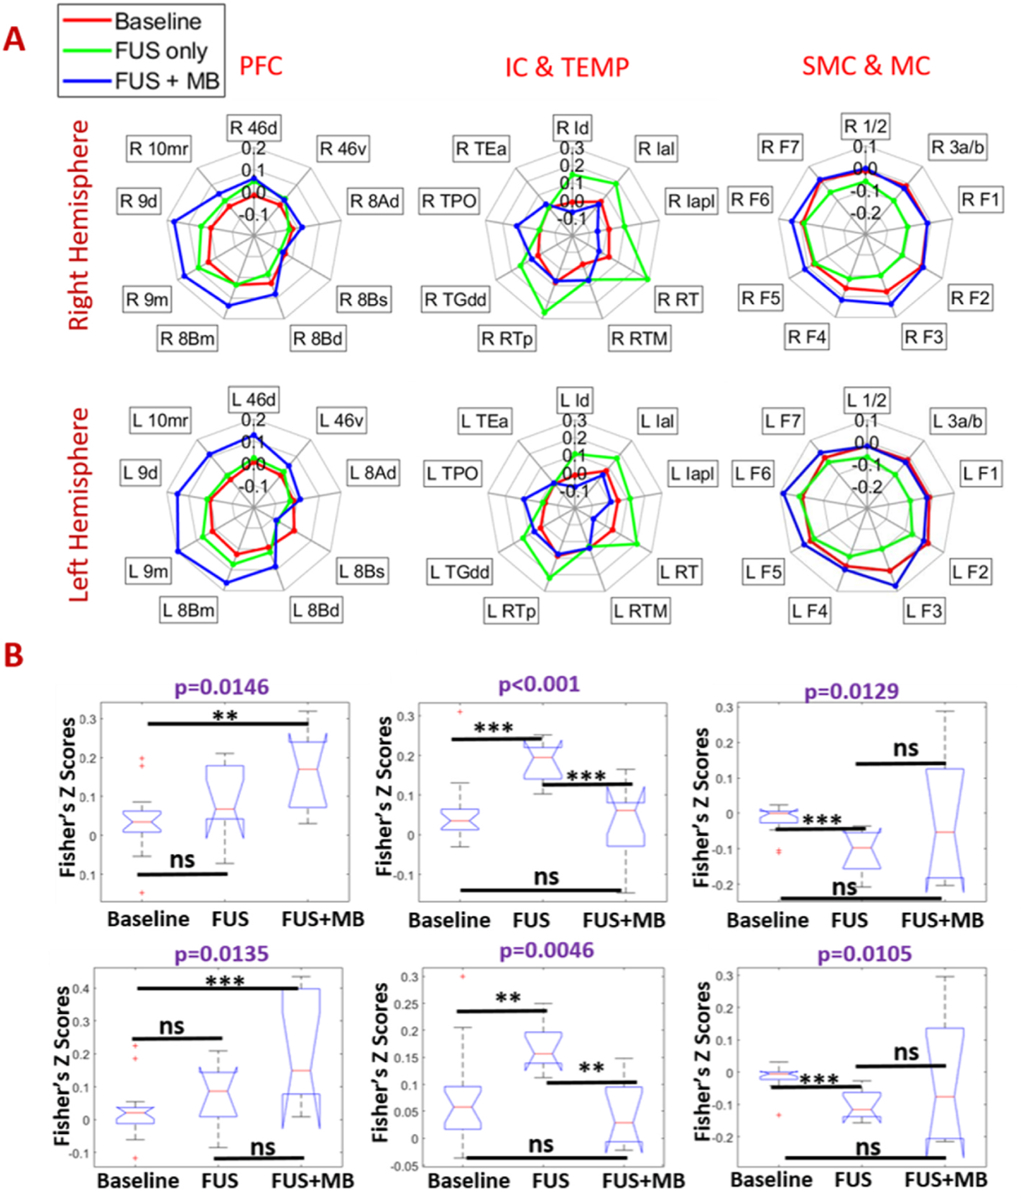
Fig. 4.

Effects of FUS and FUS-BBB opening on the functional connectivity between the caudate and the cortex: radar charts (A) and statistical box plots (B) of resting state fMRI without FUS (baseline), post-FUS (FUS only) and post-FUS with microbubbles (FUS + MB). The box plots showed the correlations of 25% percentile, 50% percentile, and 75% percentile, and outlining or extremely values. Statistical analysis was firstly performed using Kruskal-wallis test, with a purple p < 0.05 representing a significant difference. Post-hoc permutation test (5000 resamples) was performed to compare correlation values between each pair of three conditions. When there is a significant difference among the three conditions, and × denotes p < 0.05, ** denotes p < 0.01, *** denotes p < 0.001 and ns denotes p > 0.05.
