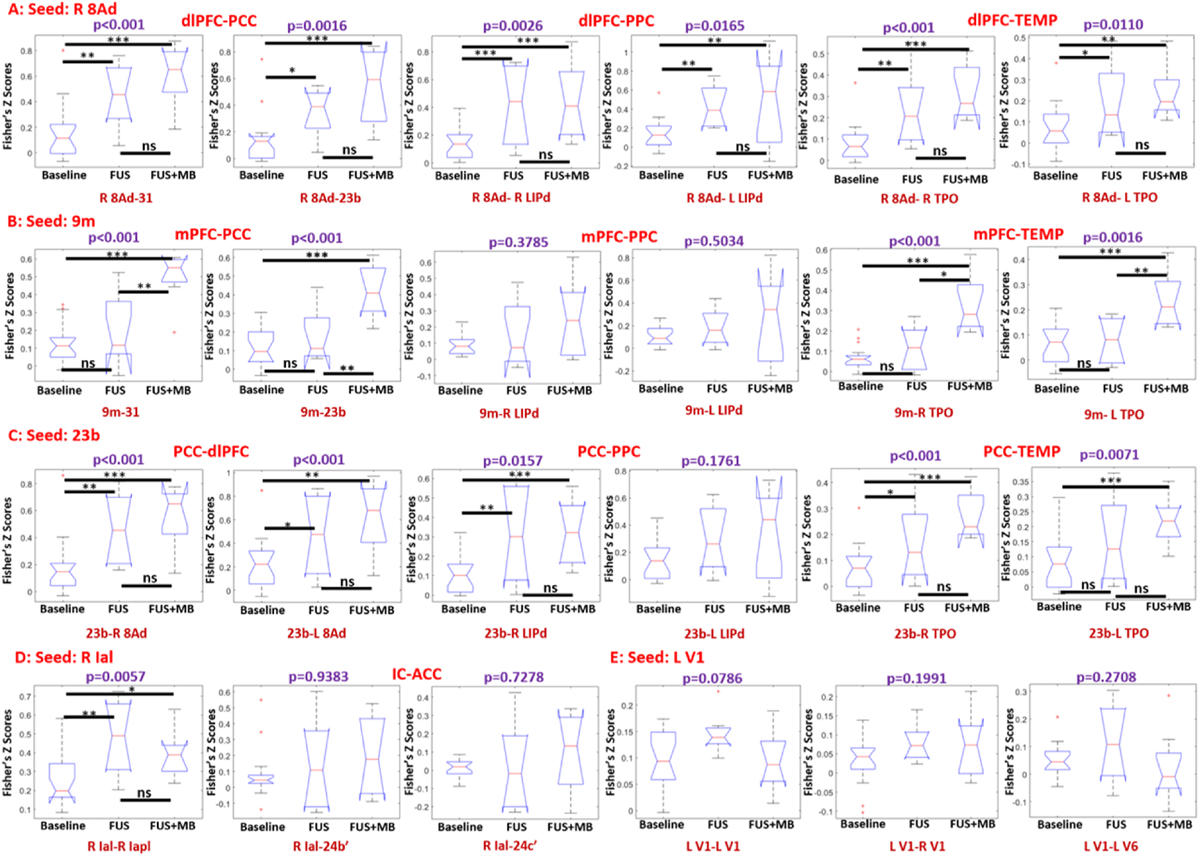
Fig. 6.

Seed-based correlation box plots with the seed ROI selected as right 8Ad (A), 9m (B), 23b(C), right Ial (D) and left V1 (E). The results indicated the changes in functional connectivity among dlPFC, PCC, PPC, TEMP, IC and ACC with the conditions of baseline, FUS and FUS with microbubbles (FUS + MB). The box plots showed the correlations of 25% percentile, 50% percentile, and 75% percentile, and outlining or extremely values. Statistical analysis was firstly performed using Kruskal-wallis test, with a purple p < 0.05 representing a significant difference. Post-hoc permutation test (5000 resamples) was performed when there was a significant difference among the three conditions, and × denotes p < 0.05, ** denotes p < 0.01, *** denotes p < 0.001 and ns denotes p > 0.05.
