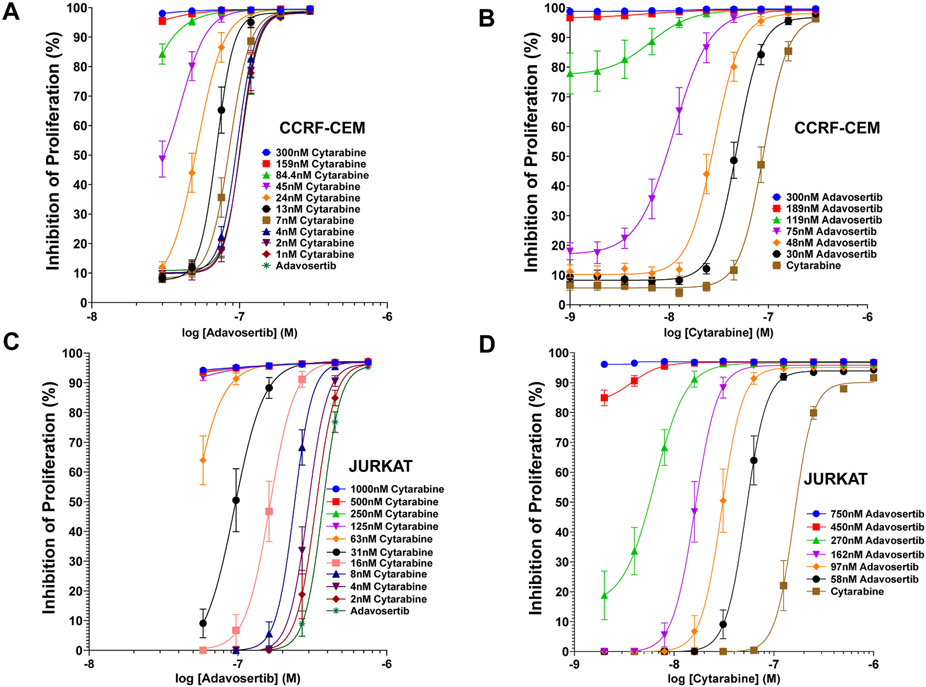
Fig. 1.
Concentration Inhibition Curves (CIC) of Adavosertib, Cytarabine and their Combinations in CCRF-CEM and Jurkat Leukemic Cell Lines. Panel A, CCRF-CEM CIC curves of adavosertib alone or combined with different fixed concentrations of cytarabine. Panel B, CCRF-CEM CIC curves of adavosertib alone or combined with different fixed concentrations of cytarabine. Panel C, Jurkat CIC curves of adavosertib alone or combined with different fixed concentrations of cytarabine. Panel D, Jurkat CIC curves of cytarabine alone or combined with different fixed concentrations of adavosertib. The second drug concentrations are included in each panel inserts with the corresponding color-coded symbols. Each data point represents the mean inhibition value with the standard error mean (SEM) (n = 8).

