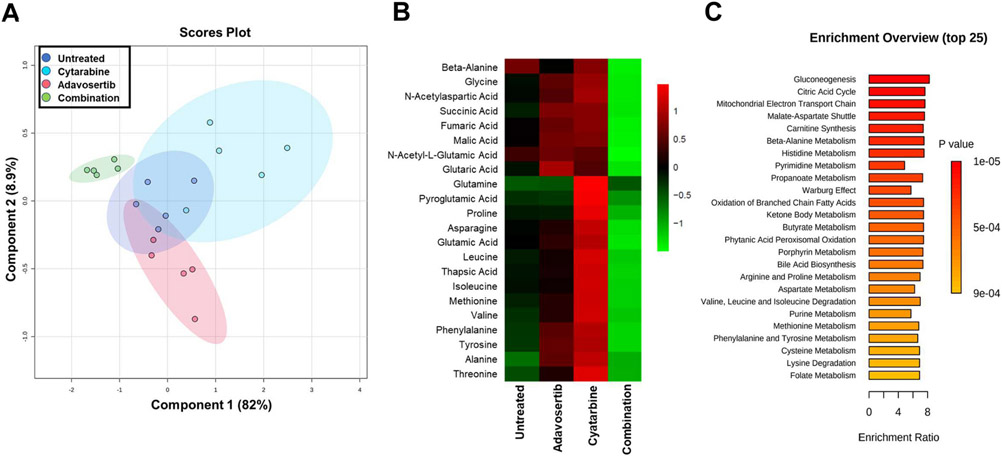
Fig. 6.
Effect of Cytarabine and Adavosertib Combination on the Jurkat Metabolome. Panel A is the partial least squares-discriminant analysis (PLS-DA) score plot showing the discriminating characteristics of the Jurkat Cell metabolomic endpoints, with a clear clustering of the data points of the different drug treatments (63 nM cytarabine, 97 nM adavosertib and their combination) and the untreated sample control after 48Hrs (see the color codes in the box inside the figure). Consideration of component 1 (82% variance) and to a lesser extent Component 2 (8.9% variance) permitted separation of the synergistic drug combination treatment from the control group and individual drug treatments that showed overlapping segments. Each group consisted of five samples. Panel B reveals the heatmaps for 22 metabolites being differentially affected after 48hrs of treatment with cytarabine (63 nM), adavosertib (97 nM) and their combination versus a control untreated group. Panel C lists the enrichment overview of the top 25 pathways affected by the combination treatment when compared against the untreated control sample (n = 5).

