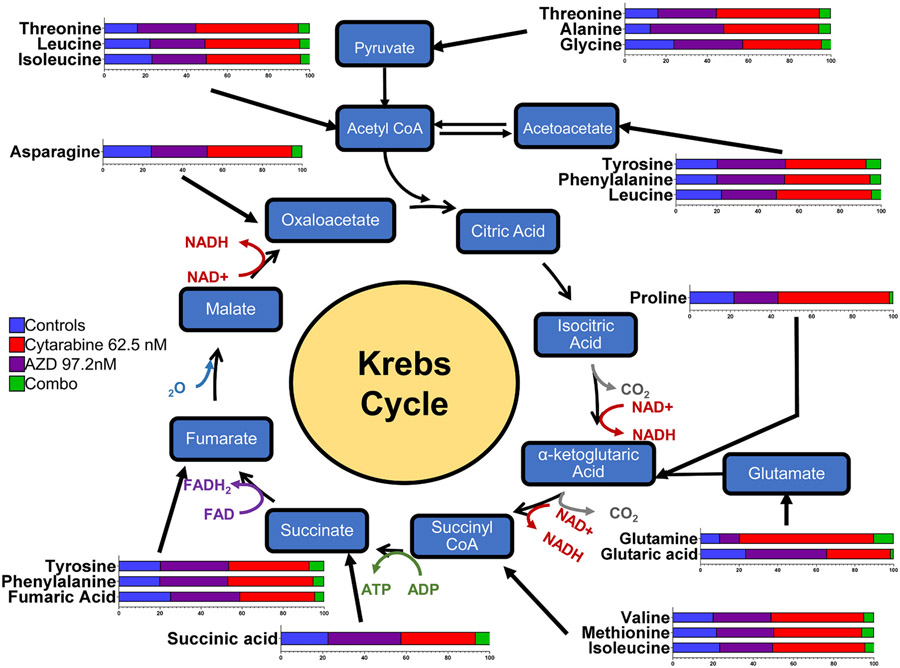
Fig. 7.
Relationship of the Jurkat Metabolites to the Krebs Cycle. The figure illustrates the relative changes (horizontal bar graphs) in the concentrations of each metabolite (amino acid) and their relationship to the Krebs cycle. The relative changes of each metabolite are further included in supplementary Fig. S2, where statistical analysis was conducted using Tukey’s test with the standard error mean (SEM) (n = 5). Statistical significances: * , p < 0.05; * *, p < 0.01; * ** , p < 0.001; * ** *, p < 0.0001.

