
Figure 1: White matter volume differences across healthy bipolar offspring, symptomatic bipolar offspring, and healthy control offspring.
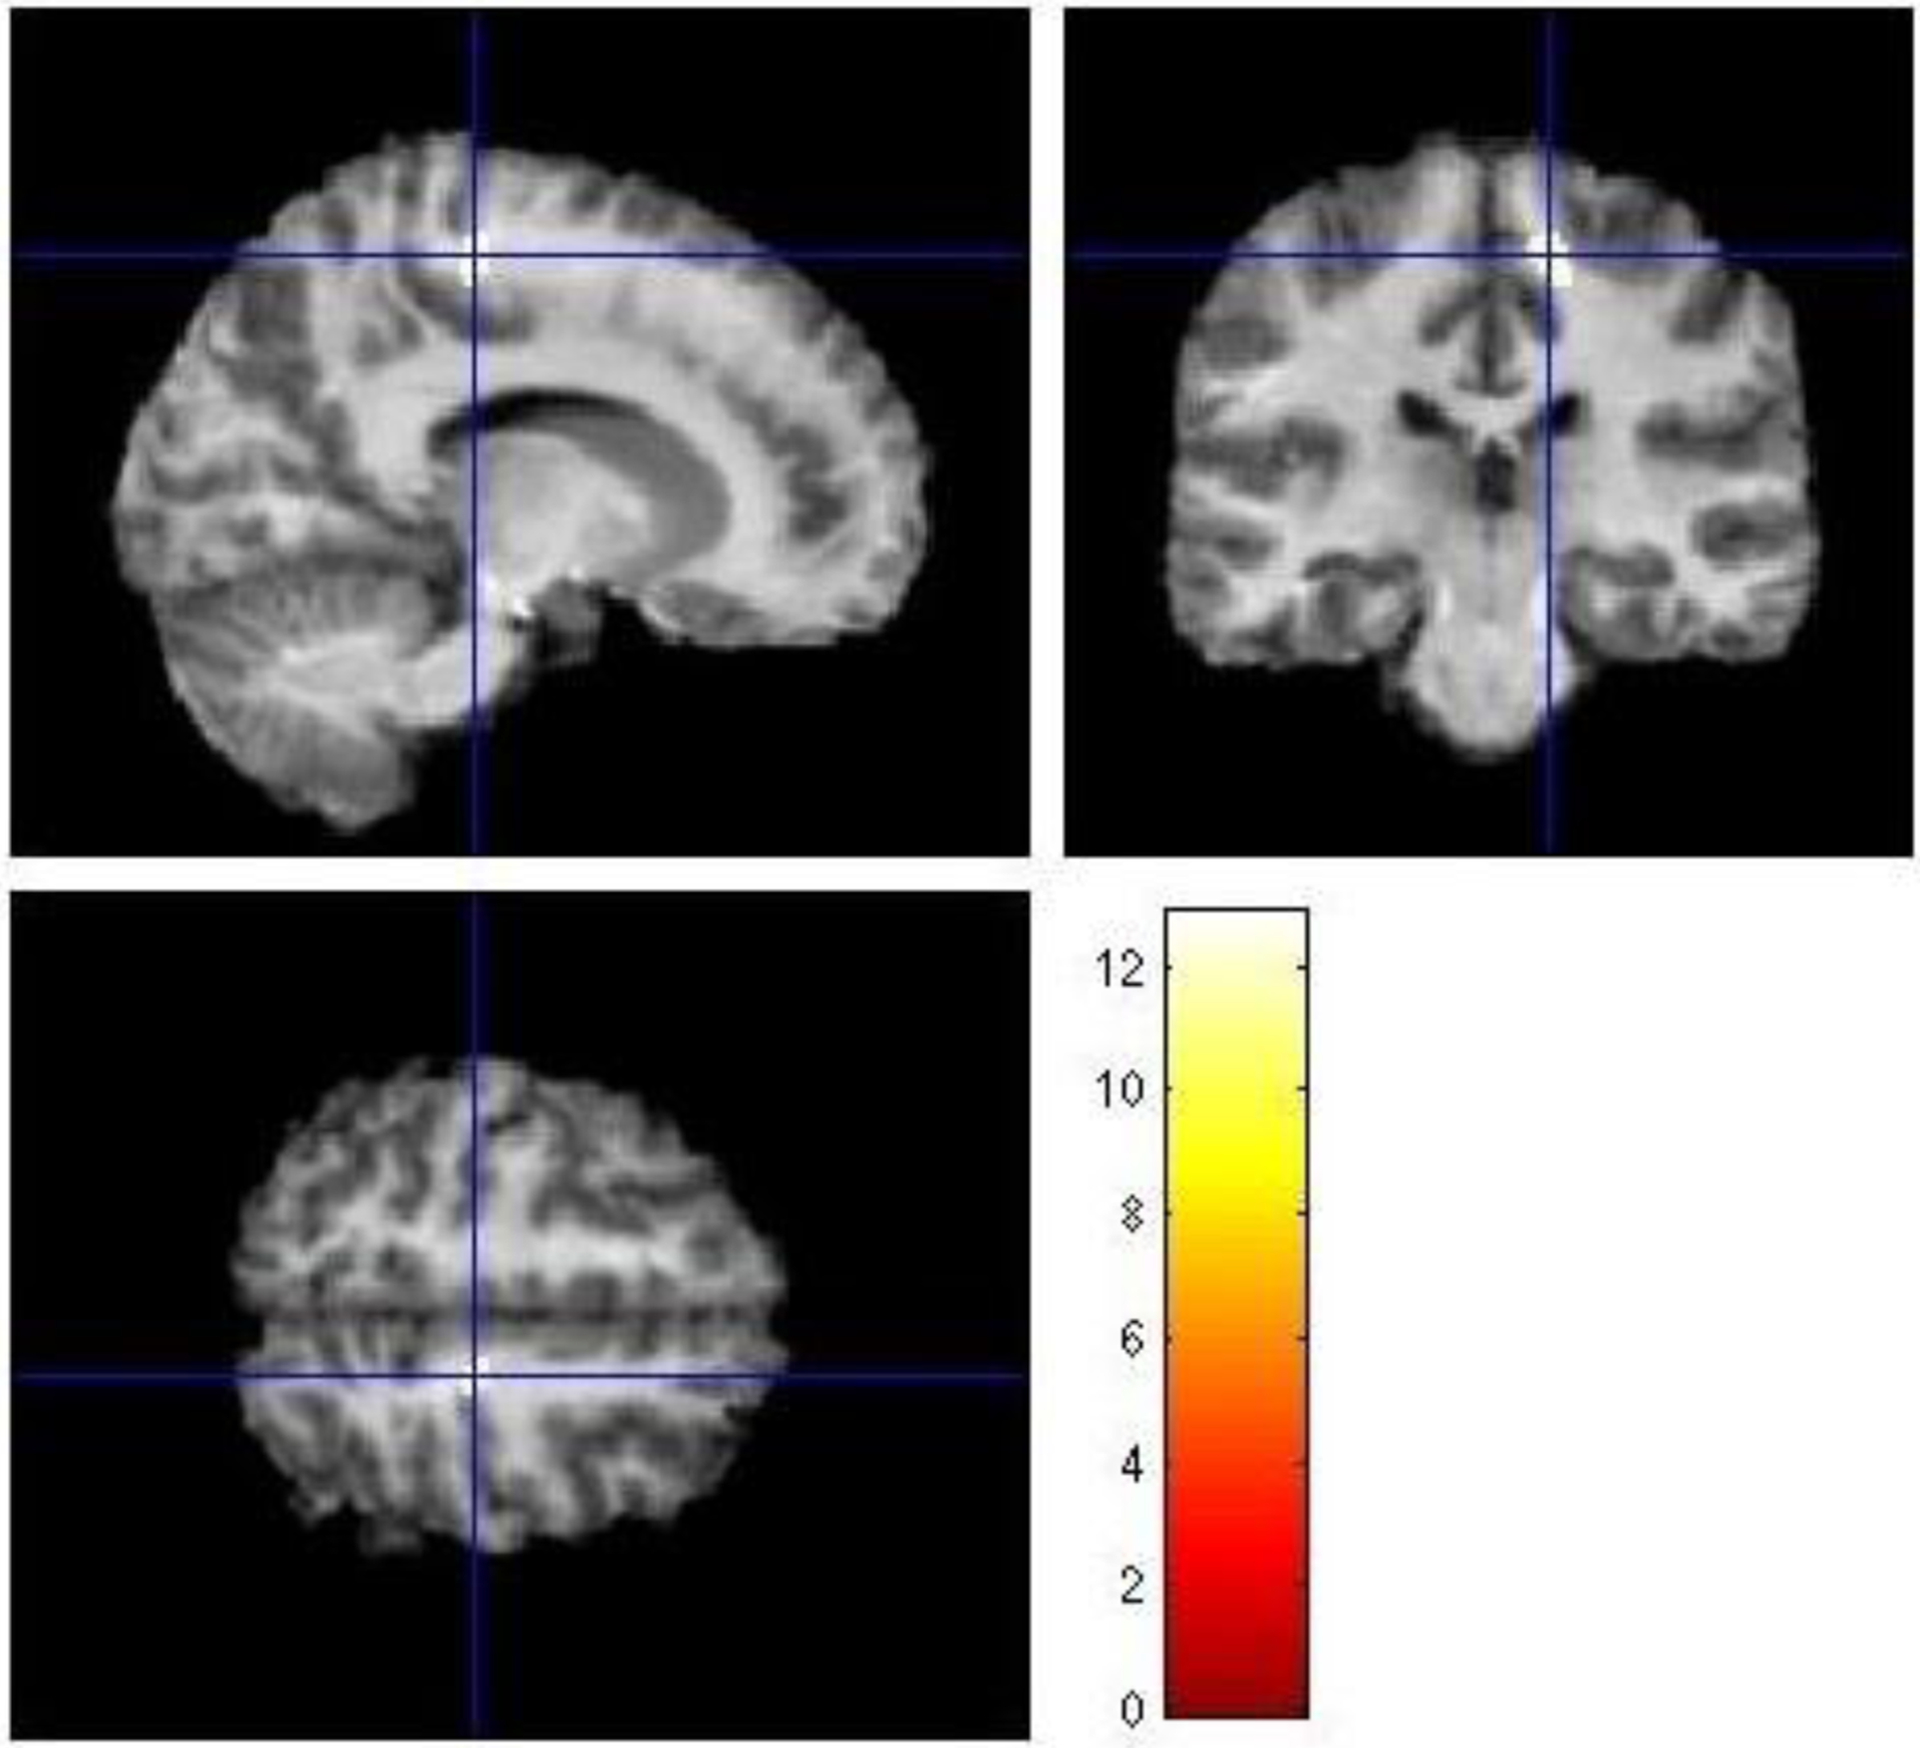
The figure depicts axial, coronal, and sagittal views of significant differences in white matter volumes across groups of healthy bipolar offspring, symptomatic bipolar offspring, and healthy control offspring. The figure depicts a cluster of significant difference in the posterior right frontal lobe (F=11.2, df=2,166, p=0.05, FDR-corrected, k=101, x=14, y=−27, z=55, right paracentral lobule).