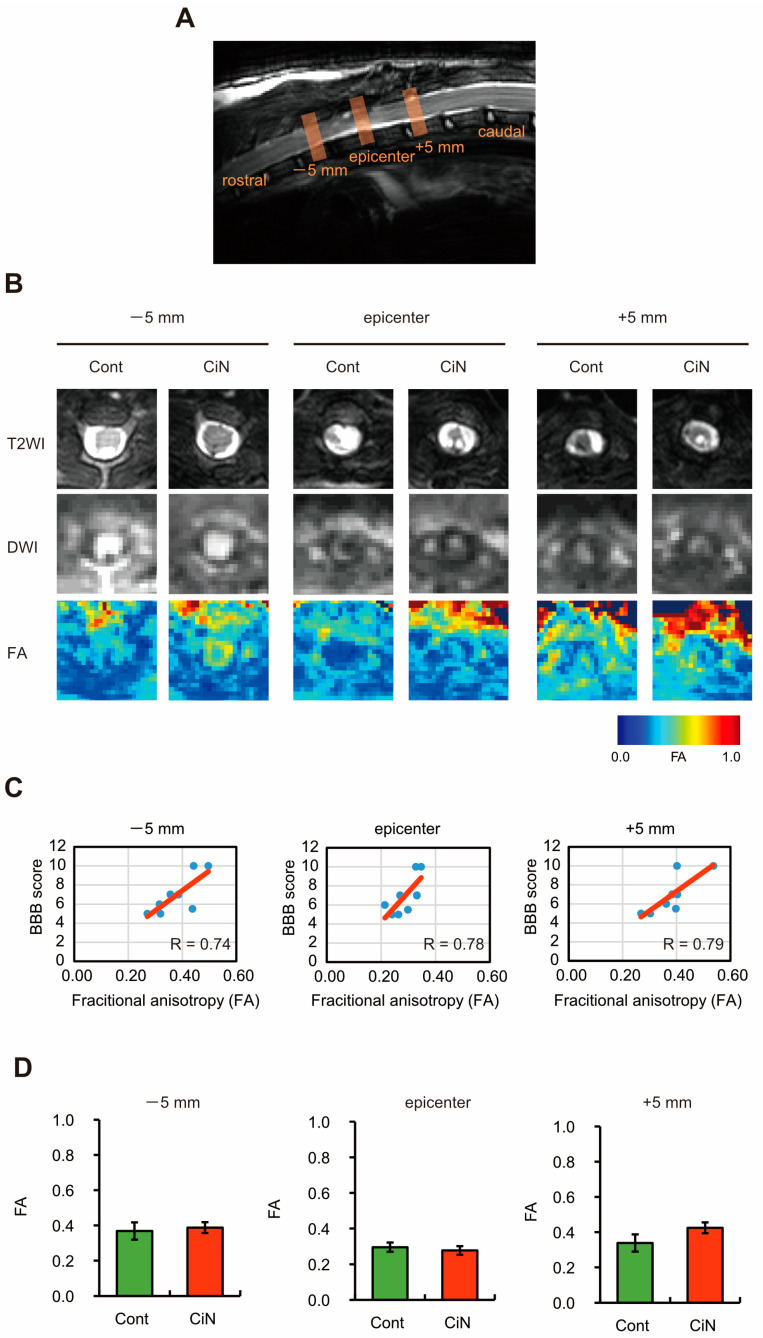
Figure 3.
Magnetic resonance imaging (MRI) analysis of the injured spinal cord. (A) Sagittal T2 weighted MR imaging of the spinal cord around the lesion epicenter site 8 weeks after SCI. (B) Axial T2 weighted MR imaging (T2WI), diffusion-weighted MR imaging (DWI), and fractional anisotropy (FA) of the injured spinal cord around the lesion epicenter site 8 weeks after SCI. The image of the data closest to the mean is shown. (C) A scatter plot showing the relationship between the BBB score and FA value at the rostral (−5 mm; left panel), epicenter (center panel), and caudal (+5 mm; right panel) sites. (D) Each FA value in panel B is graphed (n = 4 animals in the control cell-transplanted group and n = 4 animals in the CiN cell-transplanted group). The data are expressed as group means ± SEM. Abbreviations: SCI, spinal cord injury; BBB test, Basso, Beattie, and Bresnahan test; cont, control.

