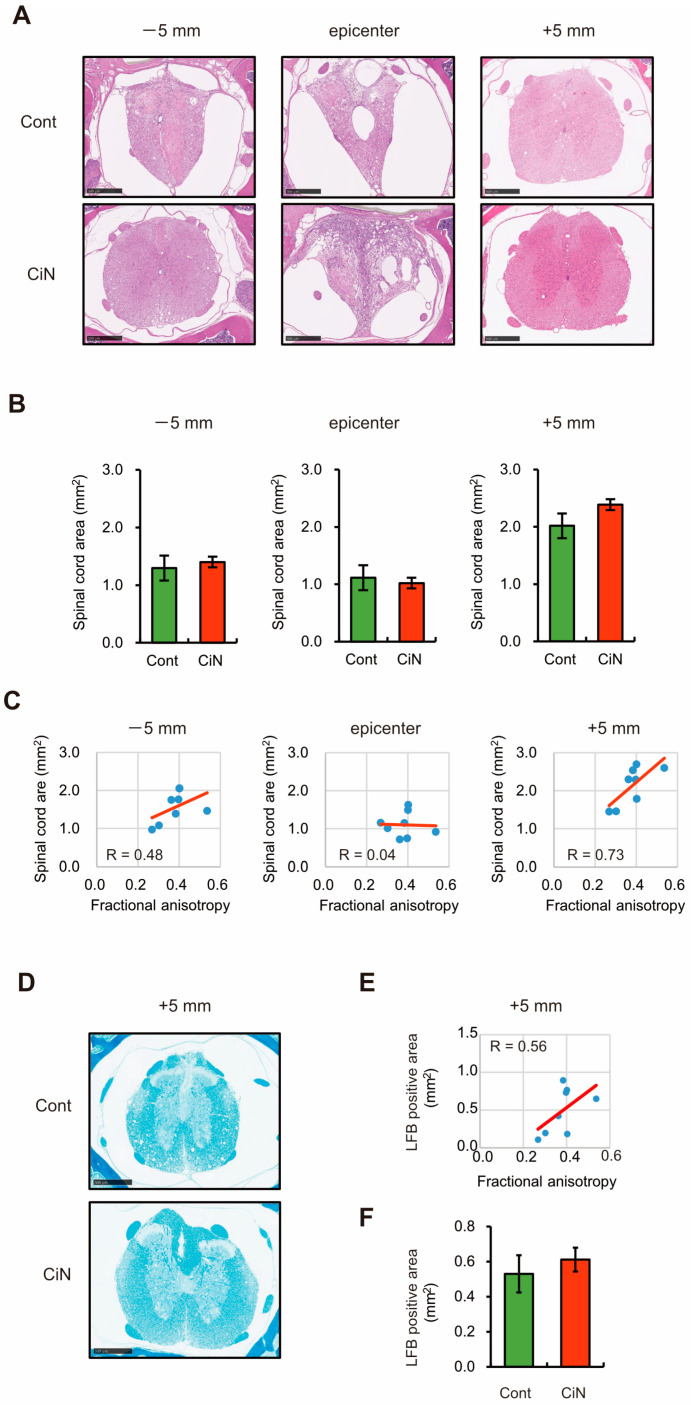
Figure 4.
Histopathological analysis of the spinal cord around the lesion site. (A) HE-staining of coronal sections at the rostral (−5 mm), epicenter, and caudal (+5 mm) segments after SCI. The image shown includes the data closest to the mean. Scale bar, 500 μm. (B) Quantitative analysis of the HE-stained area in the axial sections (n = 8 animals in the control cell-transplanted group and n = 9 animals in the CiN cell-transplanted group). (C) A scatter plot shows the relationship between the spinal cord area (HE-stained area) and FA value at the rostral (−5 mm; left panel), epicenter (center panel), and caudal (+5 mm; right panel) sites. (D) LFB-staining of coronal sections at caudal (+5 mm) segments after SCI. The image shown includes the data closest to the mean. Scale bar, 500 μm. (E) Quantitative analysis of the LFB-stained area in the axial sections (n = 8 animals in the control cell-transplanted group and n = 9 animals in the CiN cell-transplanted group). (F) A scatter plot shows the relationship between the LFB-stained area and FA value at the caudal (+5 mm) site.

