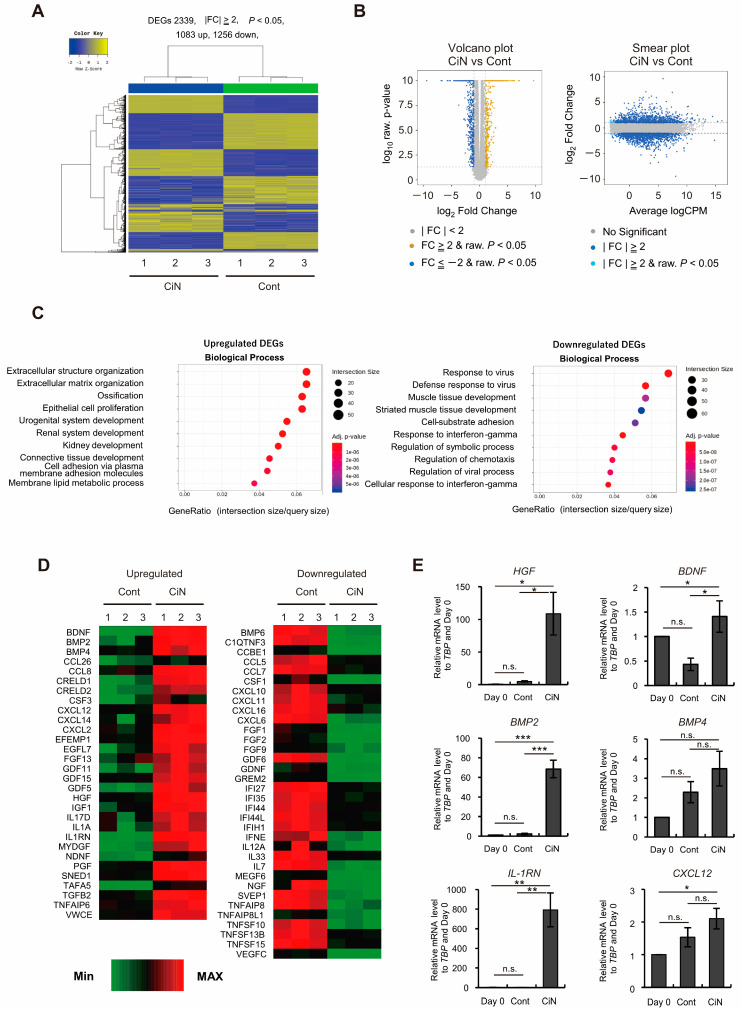
Figure 6.
Transcriptome analysis for immature CiN cell characterization. (A) The heat map shows hierarchical clustering analysis, which represents 2339 differentially expressed genes (DEGs) (|fold change (FC)|≥ 2, p < 0.05) between control and immature CiN cells. (B) Volcano and Smear plots indicate logarithmic FC (fold change), p-value, and CPM (counts per million) between control and immature CiN cells. (C) The Enrichment analysis, based on the Gene ontology (GO) database, was conducted, with a significant gene list, in the upregulated and downregulated DEGs. The top 10 GO terms are represented in the categories of biological processes. (D) Transcriptional profiles are shown as heat maps in functional groups of cytokines. The color scale shows z-scored fragments per kilobase of transcript per million mapped sequence reads (FPKM), thereby representing mRNA levels of each gene in green (lower expression) and red (higher expression). (E) Several upregulated cytokine genes were confirmed by real-time RT-PCR analysis. A p-value of less than 0.05 was considered significant. *; p < 0.05, **; p < 0.01, ***; p < 0.001., n.s.; not significant.

