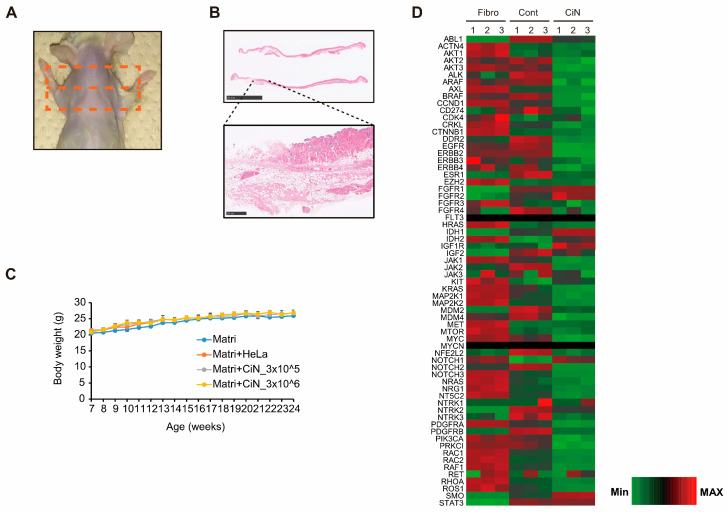
Figure 8.
Immature CiN cells are almost certainly not tumorigenic. (A) After euthanasia, the shoulder of the mouse (where the cells were implanted) was shaved. Skin from the area, circled by the orange square, was collected for histopathological analysis. (B) HE-staining images of skin samples from panel (A). Scale bar, 10 mm. The bottom panels are magnified areas from the upper panels. Scale bar, 500 μm. (C) Body weight change in each group from the time of transplantation to the end of observation (n = 3). (D) Transcriptional profiles are shown as heat maps in functional groups of tumorigenesis-related genes. The color scale shows z-scored fragments per kilobase of transcript per million mapped sequence reads (FPKM), representing the mRNA levels of each gene in green (lower expression) and red (higher expression).

