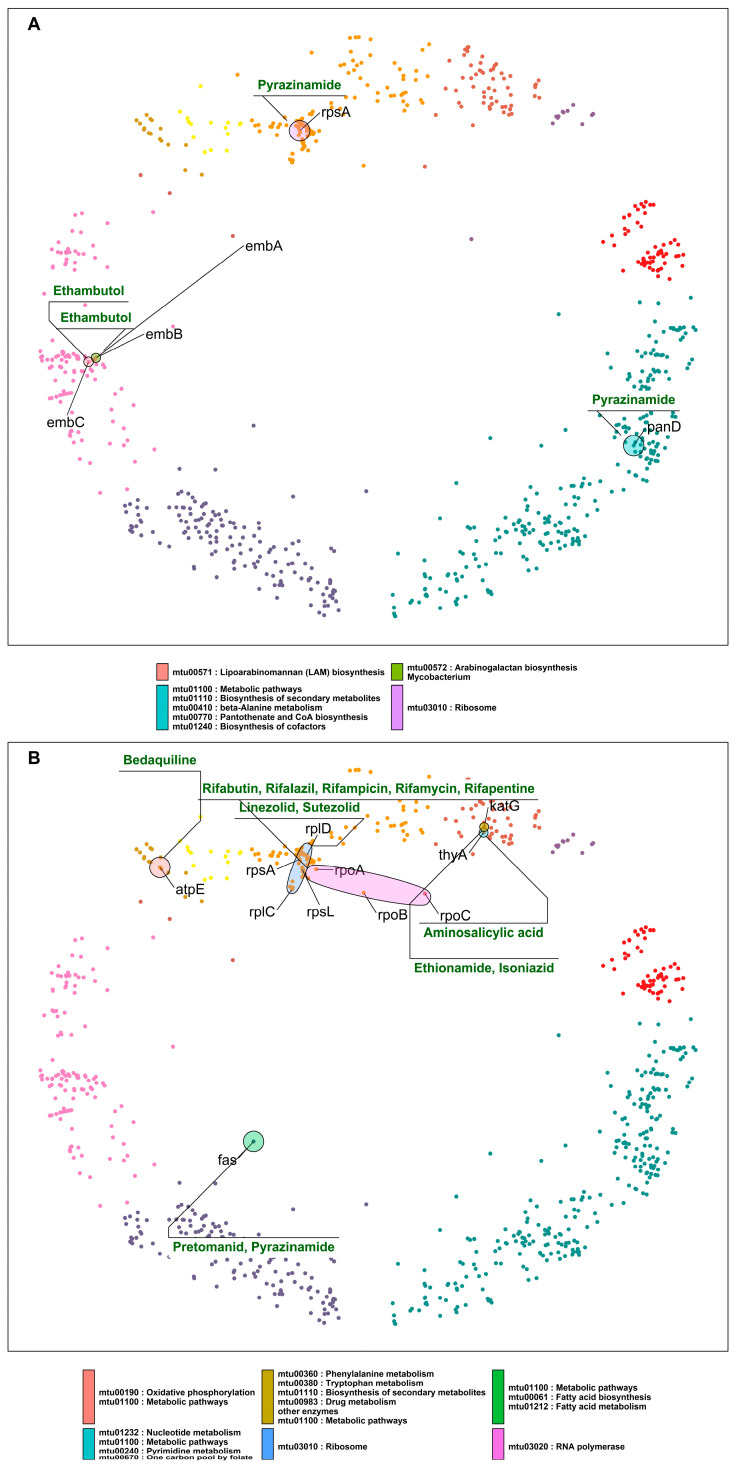
Figure 5.
(A) DT pairs that are components of different pathways and are inhibited by the same drugs. (B) DT pairs that are components of different pathways and are inhibited by different drugs. Ellipses indicate pathways and group nodes, labelled with gene symbols representing DT pairs and annotated with drugs acting on them—cluster colors as in Figure 1.

