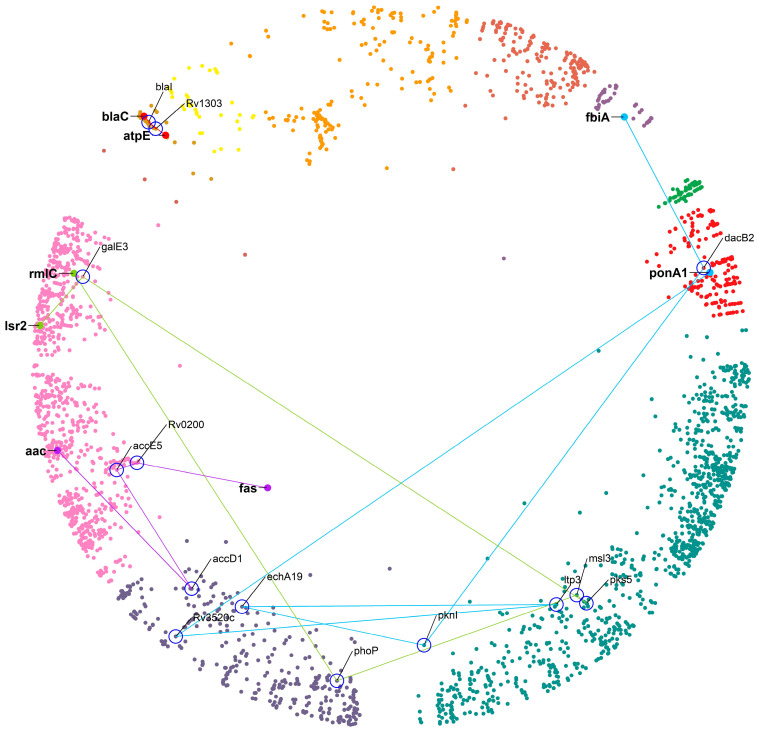
Figure 7.
The four shortlisted DT pairs hyperbolically close and connected by the shortest paths ds = 3 to 6. The DT nodes are labelled with a gene symbol (bold) and highlighted with a large size. Each path and the nodes connecting the DT pairs are represented by different colors with nodes labelled with gene symbols (not bold) and surrounded by a blue circle—cluster colors as in Figure 1.

