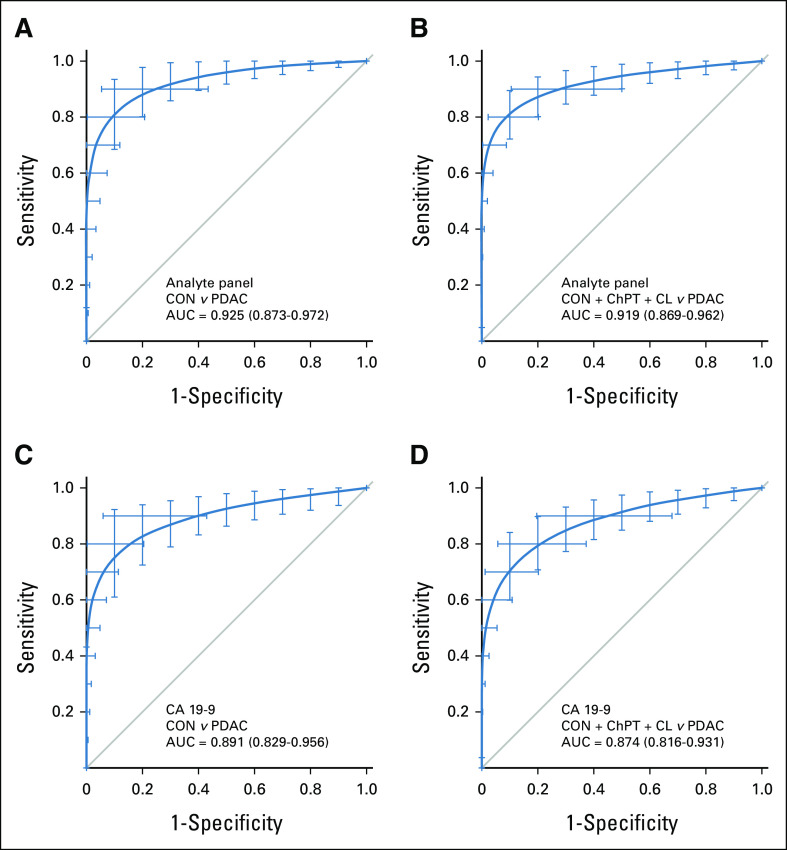
FIG 3.
Diagnostic performance in the validation set. Receiver operating characteristic curves describing the ability of the analyte panel for discrimination of (A) early-stage PDAC cases from (B) healthy controls and all non-PDAC controls including chronic pancreatitis, cystic lesions (IPMN, MCN, SCA), and healthy controls (C and D) compared with similar discrimination by CA 19-9 alone in the independent validation sample set. Bars represent 95% CIs from 2000 bootstrap iterations. AUC, area under the curve; CA, cancer antigen; ChPT, chronic pancreatitis; CL, cystic lesion; CON, healthy control; IPMN, intraductal papillary mucinous neoplasm; PDAC, pancreatic ductal adenocarcinoma.

