. 2023 Sep 1;14(37):10258–10263. doi: 10.1039/d3sc02365f

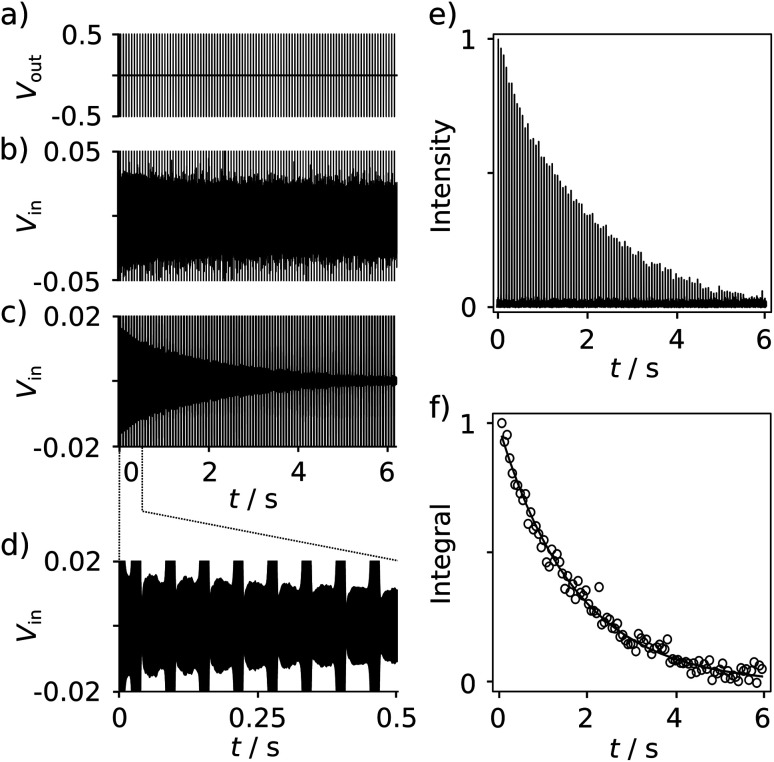
Fig. 2. (a) NMR Pulse sequence for measuring the R2 relaxation rate of reporter ligand spins. A π/2 (0.665 ms) pulse is followed by 100 π pulses (1.33 ms) spaced by 2 × τCPMG = 60 ms. (b) Time-domain trace measured from a sample of 655 μM of SABRE hyperpolarized FPCA, showing the NMR signals in-between the pulses. (c) Time-domain signals from the data in (b) processed with a digital band-pass filter (Butterworth; 33.9–34.1 kHz) to illustrate the R2 decay of the 19F signal. (d) The expanded region shows the first 8 echoes. (e) Series of Fourier-transformed 19F signals from each echo in (b). (f) Integrated 19F signals, fitted with a single exponential to obtain R2 relaxation rates.

Fig. 2