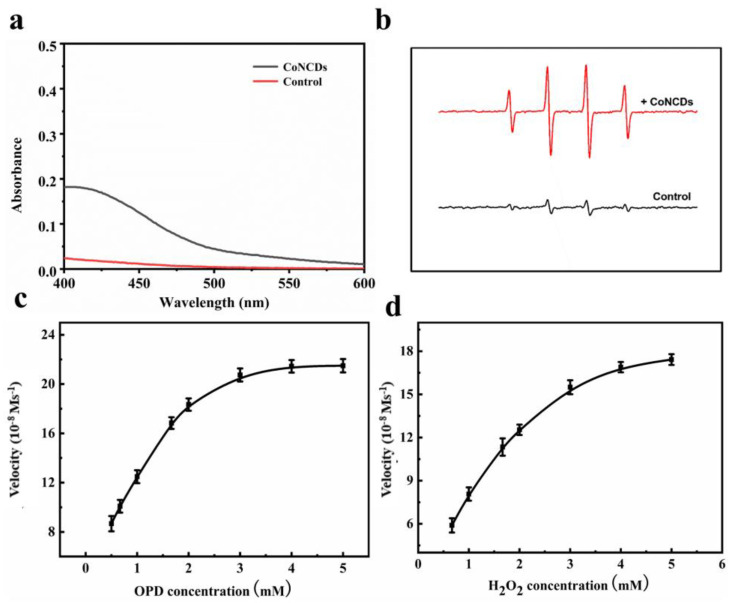
Figure 3.
The POD-like activity of CoNCDs: (a) the UV-vis spectra of OPD and H2O2 in the presence of CoNCDs; (b) electron spin resonance (ESR) spectra of CoNCDs in the presence of H2O2; (c) the velocity (v) of the reaction was measured with the change of OPD concentration (3.3 mM H2O2) at pH 7; (d) the velocity (v) of the reaction was measured with the change of H2O2 concentration (3.3 mM OPD). The error bars represent the standard deviation of three measurements.

