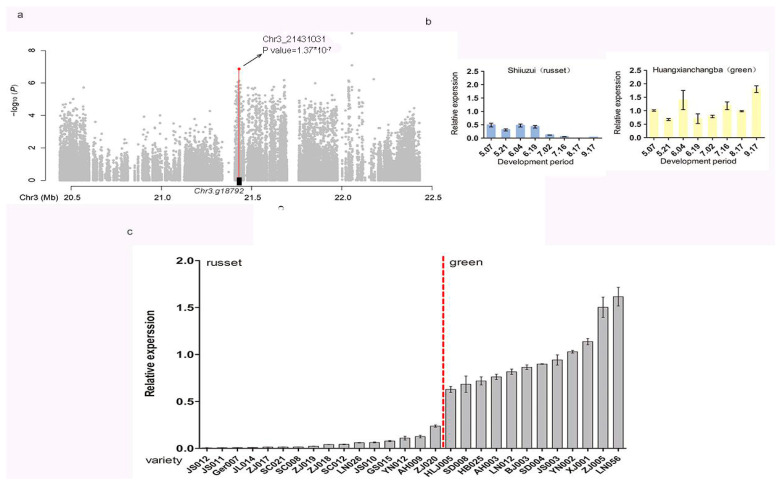
Figure 4.
Local Manhattan plot for exocarp color and expression profiles of the candidate genes in pear. (a) Local Manhattan plot for GWAS study of exocarp color. The associated SNP located 8050 bp from Chr3.g18792 (chromosome. 3: 21,431,031 bp) is marked by a red dot. (b) Relative expression of the candidate gene Chr3.g18792 in russet and green exocarp along the whole development period at two-week intervals, detected using qRT-PCR. Russet and green varieties are indicated by blue and yellow, respectively. (c) Expression of the candidate gene Chr3.g18792 at maturity in russet and green varieties. Data are represented as average values with standard deviation of triplicates for qRT-PCR.

