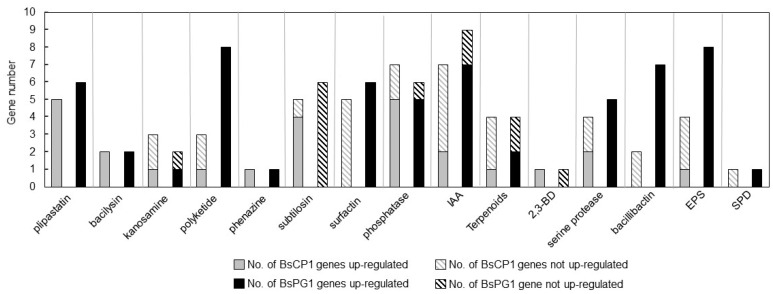
Figure 3.
Comparison of genes derived from transcriptome analyses. Genes identified from the transcriptome analysis of BsCP1 and BsPG1, associated with the synthesis of metabolites that correlate with plant growth promotion, were categorized based on their fold change in expression levels during the stationary phase compared to the log phase. Genes with a Log2[FC] value of 1.0 or higher were considered up-regulated. These are represented by a gray solid block for BsCP1 genes and a black solid block for BsPG1 genes. Genes with Log2[FC] values less than 1.0 are represented by a gray striped block for BsCP1 genes and a black striped block for BsPG1 genes. These values signify genes that are not up-regulated in expression during the stationary phase compared to the log phase.

