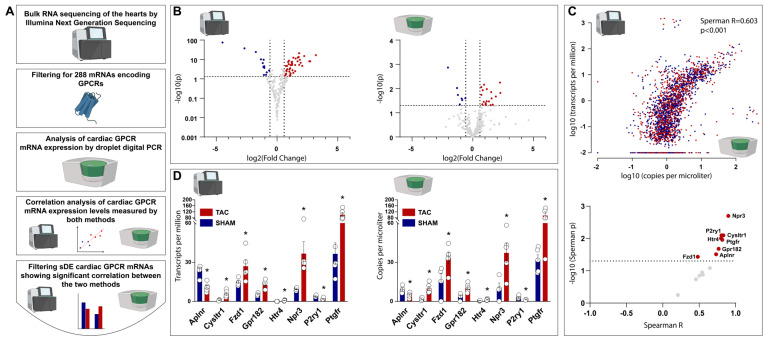
Figure 2.
Transcriptional characterization of G–protein–coupled receptors in TAC vs. SHAM rat hearts by bulk RNA sequencing and droplet digital PCR. (A) represents the workflow for transcriptional characterization of cardiac G–protein–coupled receptors (GPCRs), followed by the comparison of results obtained from bulk RNA sequencing and droplet digital PCR (ddPCR), and by the selecting of GPCRs that were found using both methods to be significantly differentially expressed in a significant correlation. (B) volcano plots showing down– and up–regulation of cardiac GPCR expression measured via bulk RNA sequencing (left figure) and via ddPCR (right figure). (C) upper figure represents correlation between bulk RNA sequencing (Y axis) and ddPCR (X axis) values for gene expression, each dot represents one GPCR gene measured in one sample; lower figure represents GPCR genes that were found to be significantly differentially expressed (sDE) in TAC vs. SHAM rat hearts identified via both methods, only eight of which showed significant correlation between the two methods. (D) box plots showing those eight GPCR genes that were found to be sDE in TAC vs. SHAM rat hearts identified via both methods in significant correlation between the two methods. For each GPCR gene, measurements were obtained from n = 5 individual rat heart from both the SHAM and the TAC groups. For bulk RNA sequencing, *: p < 0.05 vs. SHAM, Wald test; for ddPCR, *: p < 0.05 vs. SHAM, Student’s unpaired t-test, shown as mean ± SEM.

