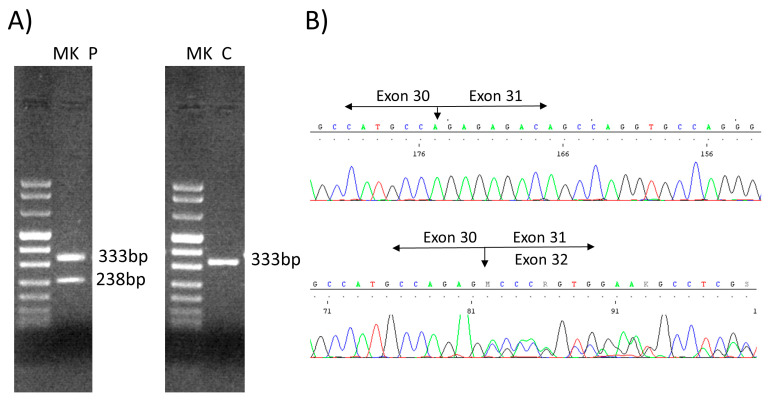
Figure 3.
(A) Agarose (2%) gel. The amplification of the proband’s cDNA with primers forward exon 29 and reverse exon 32, revealed two bands (sample P: 333 bp and 238 bp), unlike the control (sample C: 333 bp). (B) The sequencing of the amplification products from the patient compared with the control (up) revealed the excision of the entire exon 31 (95 bp) from the HSPG2-cDNA (down). P, patient; C, control; MK, marker VIII (Bio-Rad, Hercules, CA, USA).

