Figure 4.
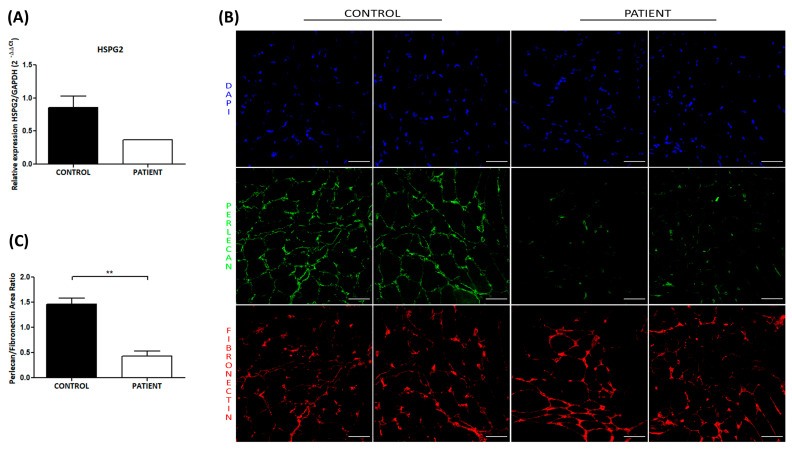
Decreased expression of perlecan in the muscle tissue of the patient was observed via real-time PCR and immunofluorescence analysis. (A) Real-time PCR analysis of HSPG2 mRNA in muscle tissue from the patient and healthy controls showed a reduction in HSPG2 transcriptional levels in the patient tissue. Transcriptional levels of HSPG2 are expressed as the 2−ΔΔCt value ± SEM. (B) Representative immunostaining images of perlecan in the muscle tissues from patient and control subject. Double immunostaining showed domain V (green) of perlecan and fibronectin (red) within the extracellular matrix. The staining revealed that the domain-V-stained the extracellular matrix at significantly reduced levels compared to the control, whereas fibronectin staining is strong in both tissues. Blue staining shows DAPI-positive nuclei. Scale bar: 50 µm. (C) Quantification of perlecan immunofluorescence in both the patient and control subject reported as the ratio ± SEM of perlecan fluorescent area normalized by the fibronectin fluorescent area. The quantitative analyses showed a significant reduction in perlecan protein in patient muscle tissue compared to the control tissue. The statistical analyses were performed through the Mann–Whitney t-test to compare non-parametric data, using GraphPad Prism version 5.0 (GraphPad Software, San Diego, CA, USA). ** p < 0.01.

