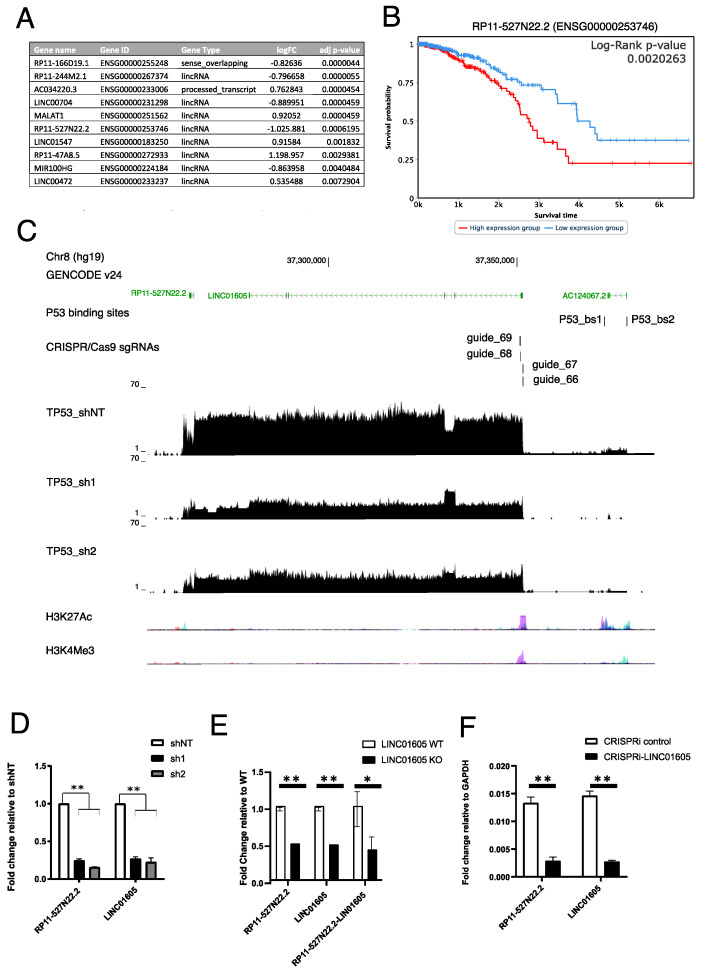
Figure 2.
RP11-527N22.2 and LINC01605 lncRNAs represent a unique transcript. (A) Table showing top 10 lncRNAs differentially expressed in MDA-MB-231 sh1 and sh2 compared to shNT with their relative log2 fold-change (logFC) and adjusted p-value. (B) Kaplan–Meier plot showing overall survival of 942 patients carrying high or low RP11-527N22.2 expressing tumours in the Breast Cancer—The Cancer Genome Atlas (BRCA-TCGA) dataset. (C) UCSC Genome Browser image showing the following from top to bottom: candidate mut_p53 binding sites near LINC01605 locus (p53_bs1 and p53_bs2), CRISPR/Cas9 single guide RNAs (sgRNAs) targeting LINC01605 first exon. BigWig files of RNA-seq reads from MDA-MB-231 shNT, sh1 and sh2 and ENCODE H3K27Ac and H3K4me3 histone mark tracks. (D) qRT-PCR showing LINC01605 and RP11-527N22.2 expression in shNT, sh1 and sh2 MDA-MB-231 cells. (E) qRT-PCR measuring expression levels of LINC01605 and RP11-527N22.2 and of a region spanning LINC01605 and RP11-527N22.2 in MDA-MB-231 cell WT and KO for the first exon of LINC01605. (F) RT-qPCR measuring expression levels of LINC01605 and RP11-527N22.2 in MDA-MB-231 cells transduced with LINC01605-CRISPRi (* p-value ≤ 0.05, ** p-value ≤ 0.01).

