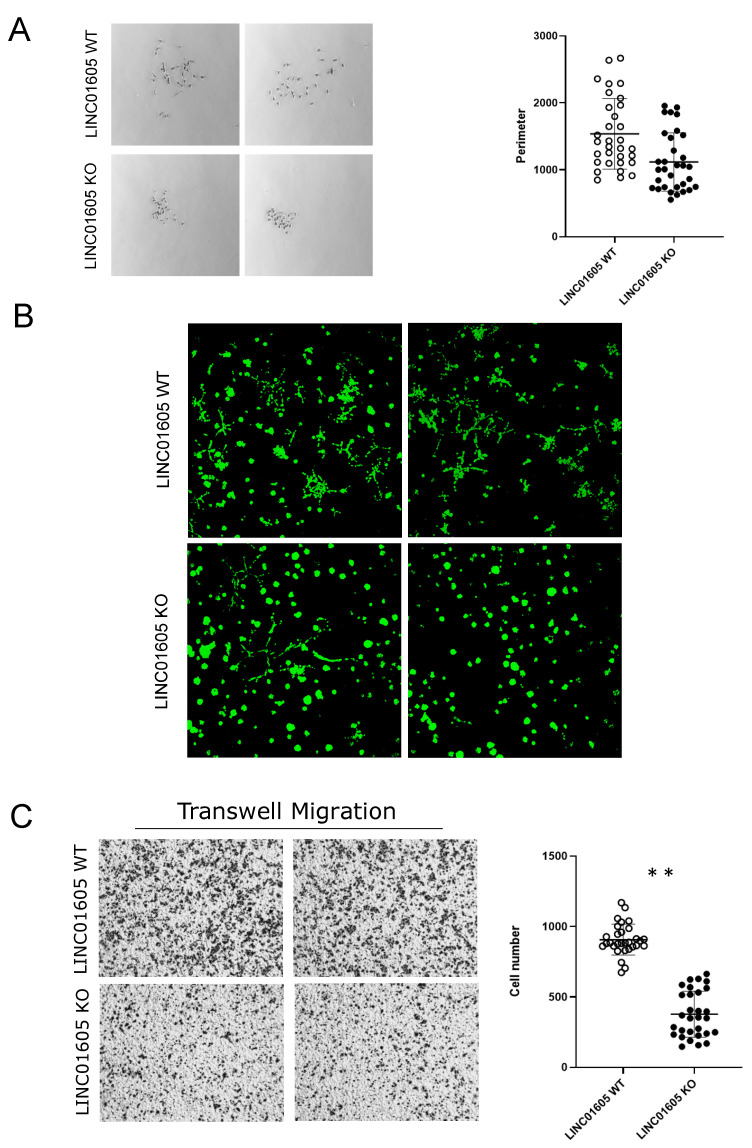
Figure 4.
LINC01605 oncogenic functions. (A) Left—representative 1× images of colonies formed by LINC01605-KO and LINC01605-WT cells Images were acquired with the stereomicroscope. Right—scatter plots showing the perimeter length of colonies formed by LINC01605-WT and KO clones using ImageJ. (B) Representative 10× images of 3D Matrigel colony assay obtained with fluorescence confocal microscopy after calcein staining. Images were acquired 10 days following cell plating. (C) Left—representative 1× images of cells migrated through fibronectin-coated Boyden chamber using the stereomicroscope. Right—count of migrated cells through Boyden chamber in MDA-MB-231 LINC01605-WT and KO cells. Images were acquired with the stereomicroscope. Fifteen different fields were acquired for each cell line and for each biological replicate (three independent biological replicates) (** p-value ≤ 0.01).

