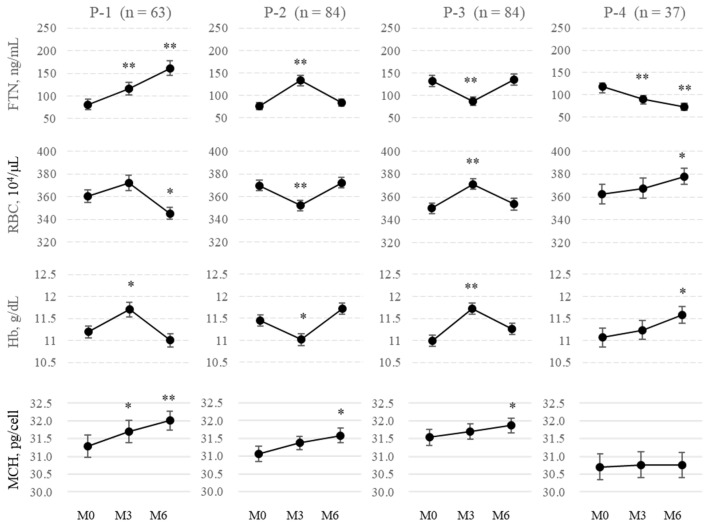
Figure 4.
Changes in FTN and iron variables every three months (n = 268). Patients were classified into four groups based on 3-month changes in FTN from M0 to M3 or from M3 to M6 (denoted as ΔFTNM3-M0 and ΔFTNM6-M3, respectively); P-1 (ΔFTNM3-M0: positive; ΔFTNM6-M3: positive; n = 63), P-2 (ΔFTNM3-M0: positive; ΔFTNM6-M3: negative; n = 84), P-3 (ΔFTNM3-M0: negative; ΔFTNM6-M3: positive; n = 84), and P-4 (ΔFTNM3-M0: negative; ΔFTNM6-M3: negative; n = 37). FTN, Ferritin; RBCs, red blood cells; Hb, hemoglobin; MCH, mean corpuscular hemoglobin. Data are shown as means ± SEM of samples. The levels of iron variables at M0 were compared with those at M3 and M6. * p < 0.05. ** p < 0.001.

