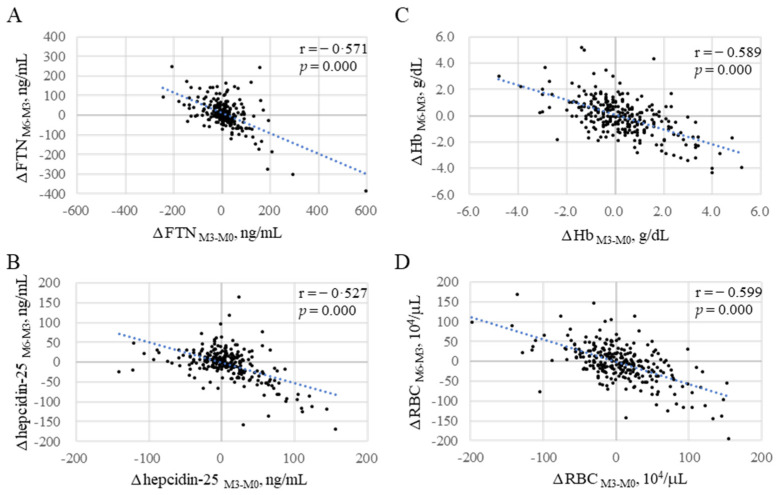
Figure 5.
Inverse correlations between the changes in iron variables from M0 to M3 and those from M3 to M6 (black dots, n = 268). (A): ΔFTNM3-M0 vs. ΔFTNM6-M3; (B): ΔRBCM3-M0 vs. ΔRBCM6-M3; (C): ΔHbM3-M0 vs. ΔHbM6-M3; (D): ΔHEPM3-M0 vs. Δhepcidin-25M6-M3. Only 63 cases (23.5%) were positive for both ΔFTNM3-M0 and Δ FTNM6-M3. ΔM3-M0: Changes from M0 to M3; ΔM6-M3: changes from M3 to M6. FTN, ferritin; Hb, hemoglobin; RBCs, red blood cells. The blue dotted line describes the regression line.

