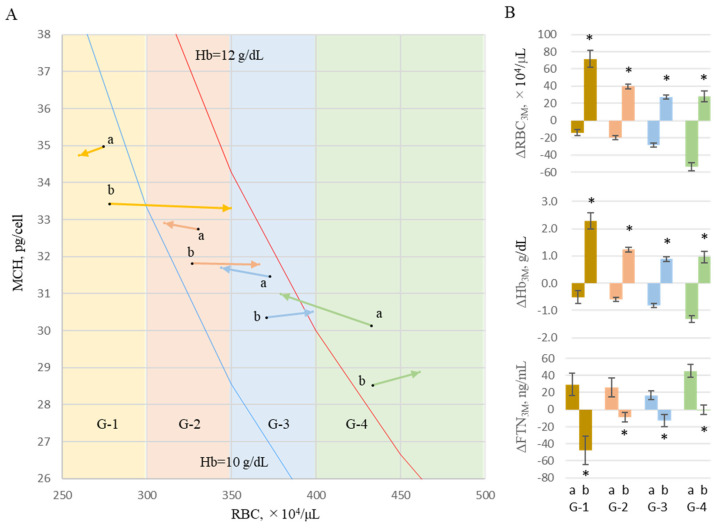
Figure 6.
Effects of RBCs on changes in FTN. To analyze the effect of the change in RBC counts on FTN values over 3 months, the levels at M0 and M3 were treated as starting points for the first and second 3-month periods, and levels at M3 and M6 were treated as 3-month points, respectively. Two datasets of iron variables were evaluated equally, and the changes in iron variables over 3 months were represented as Δ3M (n = 536). Each case was classified into 4 groups, G-1, G-2, G-3, and G-4, according to the RBC value at start points (M0 and M3): RBC ≤ 300, 300 < RBC ≤ 350, 350 < RBC ≤ 400 and RBC > 400 × 104/μL, respectively. Furthermore, each case was classified into G-a when each ΔRBC3M was negative and G-b when positive. (A) The start and end points were vectorized as the mean values of MCH and RBCs. Hb 10g/dL-line (blue) and Hb 12g/dL-line (red) are shown based on the formula Hb = RBC × MCH. (B) The levels of ΔFTN3M were presented in each group. Data are shown as mean ± SEM of samples. RBCs, red blood cells; MCH, mean corpuscular hemoglobin; Hb, hemoglobin; FTN, ferritin. The levels of G-a were compared with those of G-b. * p < 0.05.

