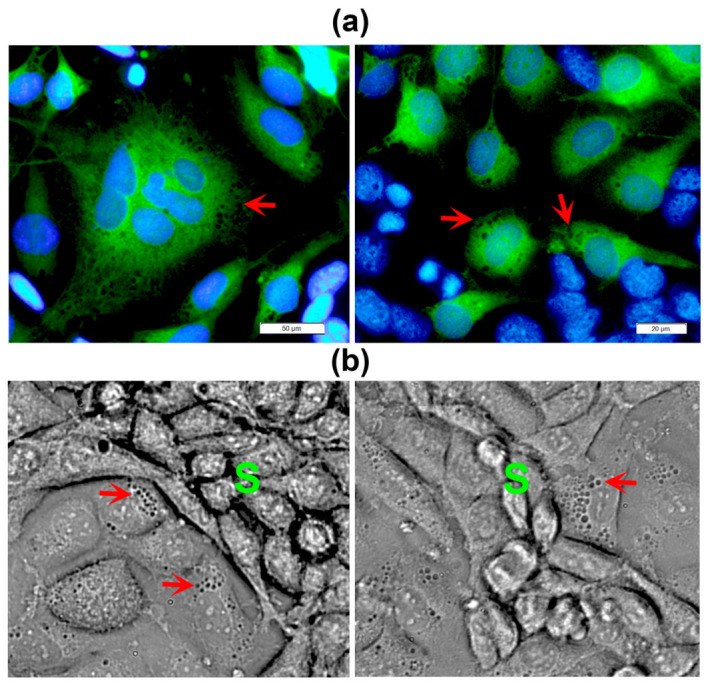
Figure 3.

In close areas neighboring the VM segments endothelial cells show a highly vacuolated cytoplasm. (a) EA.hy926 cells were labeled with a green cell tracker before co-culturing them with unlabeled MBCDF-T cells for 48 h. Nuclei were counterstained with DAPI (blue channel). Non-green cells represent cancer cells. Magnifications from 20× and 40× images; scale bar = 50 μm and 20 μm in left and right panel, respectively. (b) Live HCC1806 cells co-cultured with EA.hy926 cells during 48 h were photographed. Red arrows show vacuoles in the endothelial cells neighboring the VM segments (S). Cancer cells appear smaller and elongated, with a low cytoplasm/nucleus ratio, while endothelial cells look bigger and flattened, with large nuclei and greater cytoplasm/nucleus ratio. Magnifications from 40× bright field images are shown.
