Figure 5.
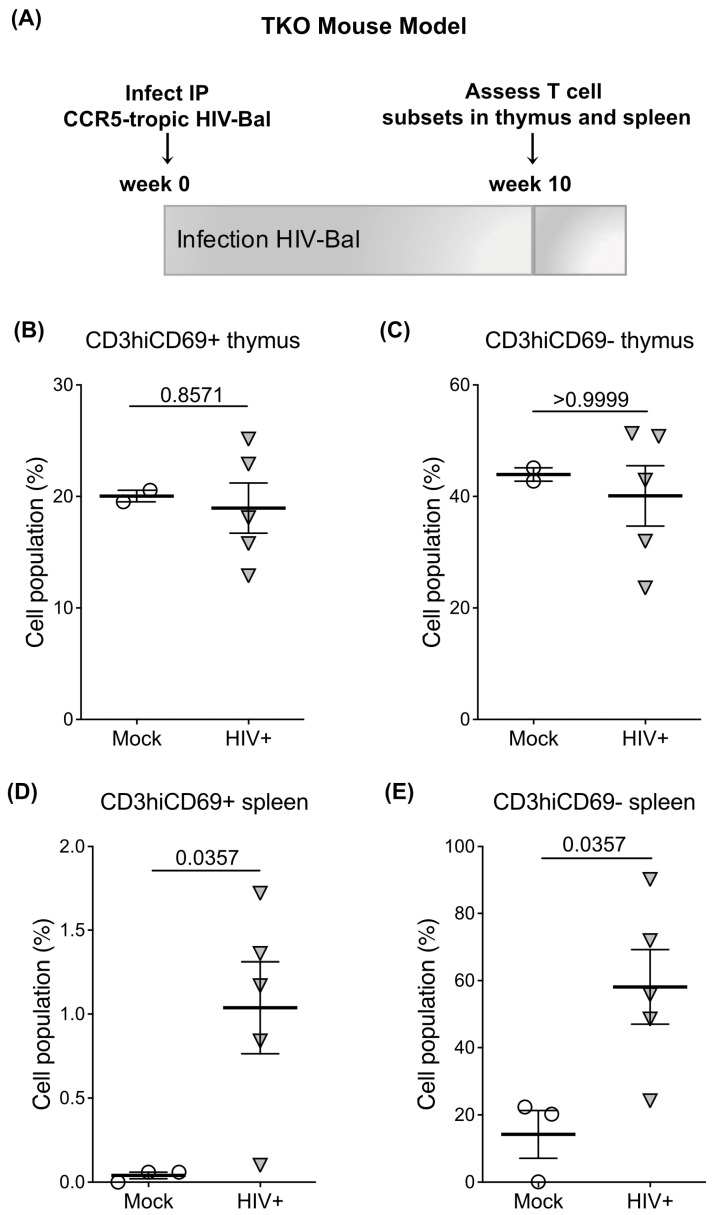
Dynamics of lymphocyte egress in HIV-infected BLT-TKO mice. (A) Schematic of TKO mouse model of infection with CCR5-tropic HIV (Bal) and analysis of thymic and splenic human CD45+ T cell subsets at 10 weeks post-infection (n = 3 mock and n = 5 HIV-1; n = 8 mice total). (B) CD3hiCD69+ T cells in the thymus of Bal (n = 5) and mock (n = 3) infected BLT TKO mice. (C) CD3hiCD69− T cells in the thymus of Bal and mock-infected BLT-TKO mice. (D) CD3hiCD69+ T cells in the spleen of Bal and mock-infected BLT TKO mice. (E) CD3hiCD69− T cells in the spleen of Bal and mock-infected BLT-TKO mice. The mean with the standard error of the mean (SEM) is shown. All comparisons were done by unpaired t-test.

