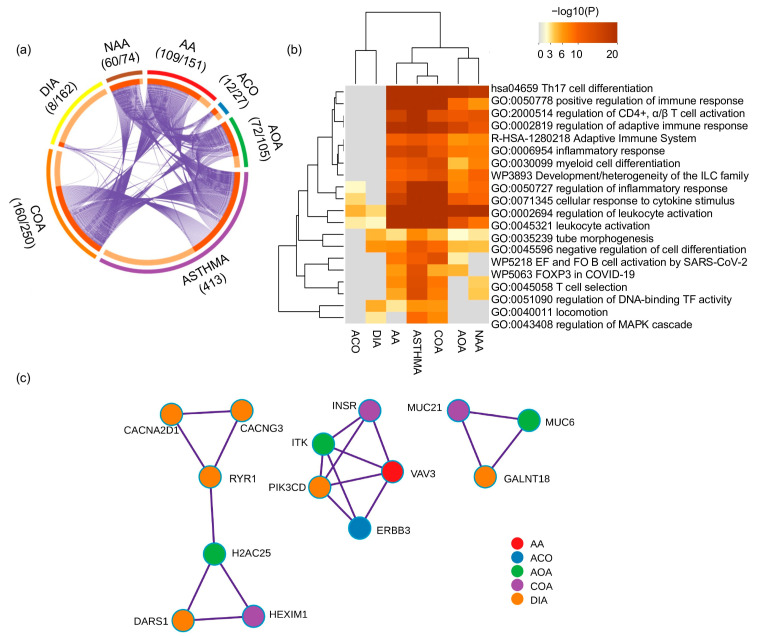
Figure 4.
Genetic findings of asthma phenotypes. (a) Circos plot depicting the overlap of genes annotated based on the genetic variation associated across asthma phenotypes. The outer arc represents the identity of each gene list, whereas the inner arc represents a gene list, where each gene member of that list is assigned a spot on the arc. The dark orange color represents the genes shared by multiple gene lists, and light orange color represents genes specific to that gene list. The number of genes overlapping between each gene list and the 413 genes from the asthma gene list and the total number of genes within each gene list are shown along with each phenotype term. (b) Gene-set enrichment analysis of asthma and asthma phenotype-related genes. (c) Prioritized subnetworks for distinct genes for asthma phenotypes. Abbreviations: AA: allergic asthma; ACO: asthma–chronic obstructive pulmonary disease overlap syndrome; AOA: adult-onset asthma; COA: childhood-onset asthma; DIA: diisocyanate-induced asthma; EF: extrafollicular; FO: follicular; NAA: nonatopic asthma; TF: transcription factor.

