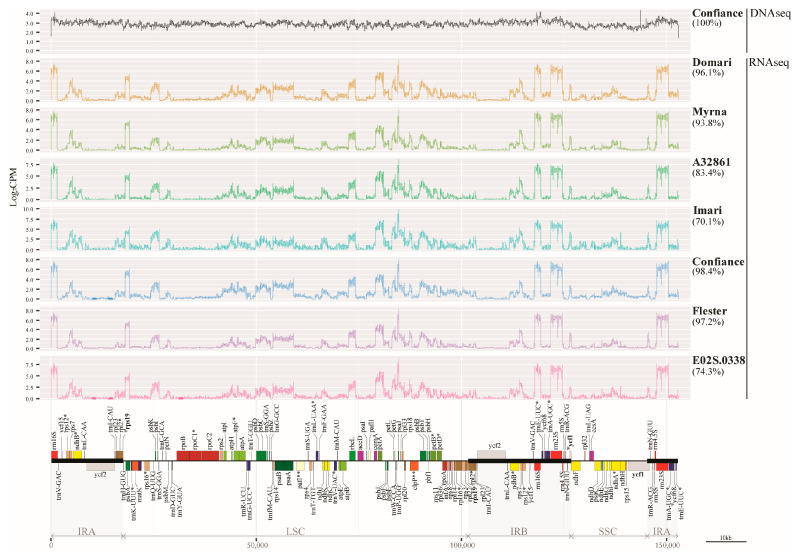
Figure 3.
Coverage plots. Top: coverage of DNA-Seq (black line) and RNA-Seq (coloured lines) data over the reference cp genome measured as the logarithm of counts per million reads aligned over a given region. Bottom: linearised map of the cp genome. Genes marking region boundaries are bolded. *, Single intron gene; **, gene containing two introns; Ψ, pseudogene.

