
FIGURE 1.
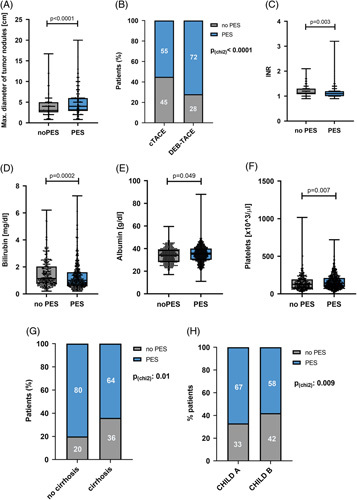
Predictive factors for occurrence of PES in patients with HCC after TACE. (A) Maximum diameter of tumor nodules in patients with PES compared to patients without PES after TACE (p < 0.0001, U test). (B) Frequency of PES in patients with HCC receiving conventional or DEB-TACE (p < 0.0001, χ2 test). (C) INR (international normalized ratio) in patients with PES compared to patients without PES after TACE (p = 0.003, U test). (D) Bilirubin level (mg/dL) in patients with PES compared to patients without PES after TACE (p = 0.0002, U test). (E) Albumin level (g/dL) in patients with PES compared to patients without PES (p = 0.049, U test). (F) Platelets (<103/μL) in patients with PES compared to patients without PES (p = 0.007, U test). (G) Frequency of PES in patients with or without cirrhosis (p = 0.01, χ2 test). (H) Frequency of PES in patients with CHILD A or CHILD B cirrhosis (p = 0.009, χ2 test). Box plots show individual data points, median, interquartile range, minimum, and maximum. Abbreviations: DEB-TACE, drug-eluting bead transarterial chemoembolization; PES, postembolization syndrome.