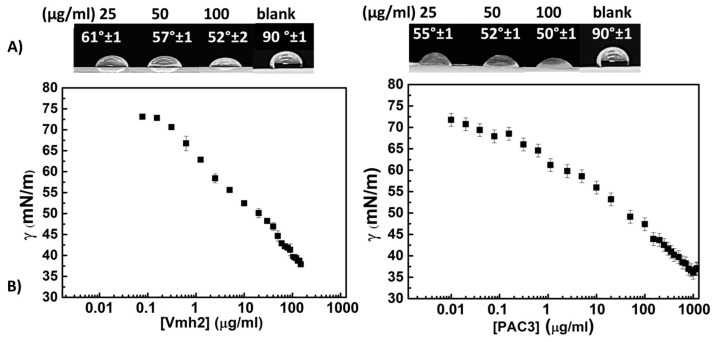
Figure 7.
Surface activity. (A) Drop collapse tests of Vmh2 solution on the left, PAC3 on the right. A total of 10 µL of protein solution at increasing concentrations was deposited on Parafilm, and pictures were acquired after 10′. Contact angles were estimated using Image J version: 1.8.0. (B) Surface tension curves of Vmh2 and PAC3. Each protein was suspended in 50 mM Tris HCl pH 8, and curves were obtained using the Du Noüy ring method. Error bars in the graph represent the standard deviation calculated based on at least two biological and three technical replicates.

