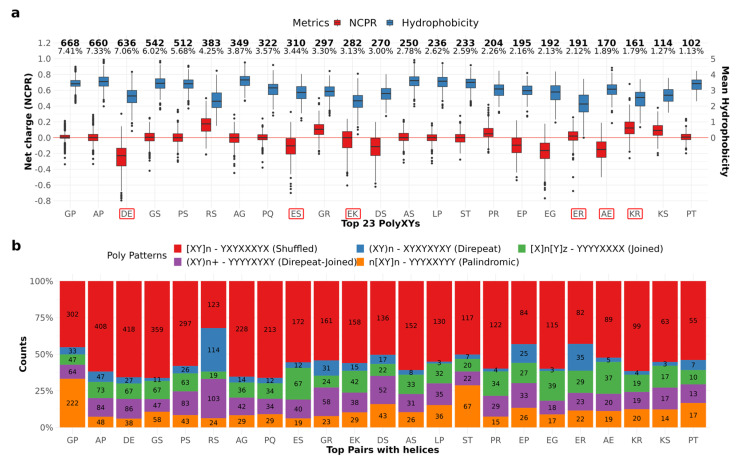
Figure 2.
IDR properties and polyXY categorization. (a) Canonical properties of the IDR region by polyXY within the IDR. Left y-axis shows net charge fractions, while the right y-axis shows average hydrophobicity with positive values only. The horizontal red line delimits uncharged IDRs. The 23 more common pairs are shown, which represent almost 81% of the cases. The numbers at the top of the figure show the total counts and percentages of each residue in our dataset. IDRs were sorted by frequency and pairs with higher helical content are highlighted in red. (b) Categorization of polyXYs according to patterns observed in the polyXY region.

