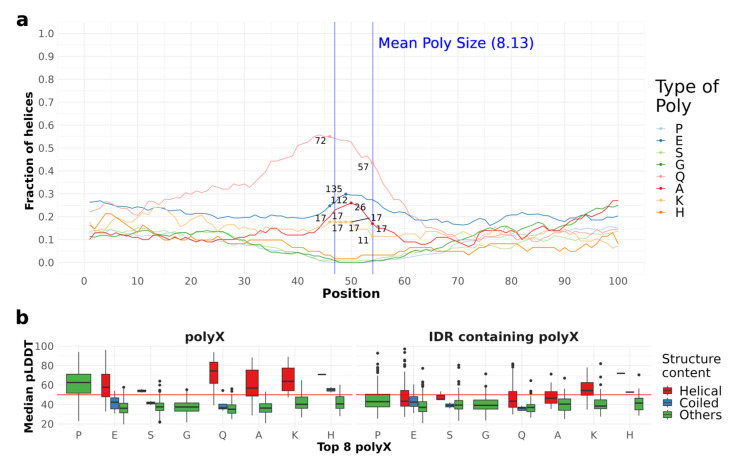
Figure 5.
Fraction of helical residues and pLDDT distribution for polyX. (a) The fraction of helical residues for the eight most common polyXs is presented as lines in the plot, whilst just the higher and smaller counts within the region are shown per polyX type, to delimit the region counts compared to the fractions. The blue vertical lines delimit the mean size of polyX regions for reference. (b) Distribution of pLDDTs for polyX and IDRs grouped by type of secondary structure content. Helical indicates polyX with at least four consecutive residues predicted to be in helical conformation. Coiled indicates polyX with at least four consecutive residues predicted as coiled.

