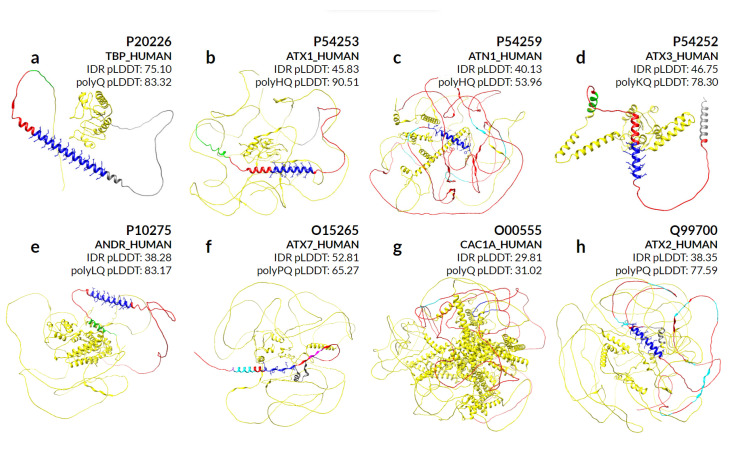
Figure 7.
AlphaFold structural predictions of proteins associated with diseases caused by polyQ expansion. PolyQ/QX are shown with stick representation in blue. Green and gray residues highlight N and C-terminal 50 amino acids from the center of the polyQ/QX, respectively. Residues in red delimit the IDR region and cyan, when shown, represents other polyXYs within the polyQ containing IDR. Median pLDDT values are shown for the IDR and polyQX regions (blue), while the remaining values are available in Supplementary Tables S1 and S2. The following proteins are illustrated: (a) P20226-TBP_HUMAN; (b) P54253-ATXN1_HUMAN; (c) P54259-ATN1_HUMAN; (d) P54252-ATXN3_HUMAN; (e) P10275-ANDR_HUMAN; and (f) O15265-ATXN7_HUMAN. Extra purple and magenta colors delimit adjacent polyXYs (polyAR, polyAG, polyPQ and polyPR); (g) O00555-CAC1A_HUMAN; (h) Q99700-ATX2_HUMAN.

