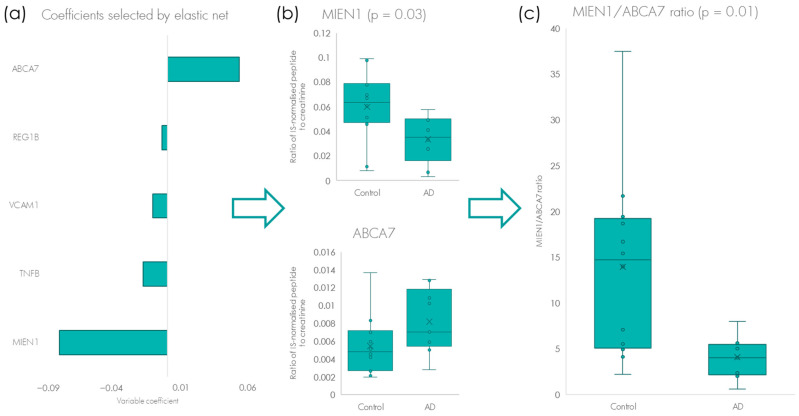
Figure 3.
(a) Identification of the five proteins that demonstrated significant elevation or were present in lower amounts in the urine of patients with a confirmed AD diagnosis (MIEN1, TNF-beta, VCAM1, REG1B and ABCA7). (b) Univariate analyses of the two proteins most up- and down regulated, ABCA7 and MIEN1, respectively, with MIEN1 being statistically significantly elevated (p = 0.03). (c) By looking at the ratio of the biomarkers ABAC7 and MIEN1 to one another, increases the statistical significance between AD and controls even further (p = 0.01). The whiskers show the minimum and maximum and the boxes show the 25th percentile, the median and the 75th percentile. Values outside 1.5 fold the interquartile are represented by dots. x represents the mean.

