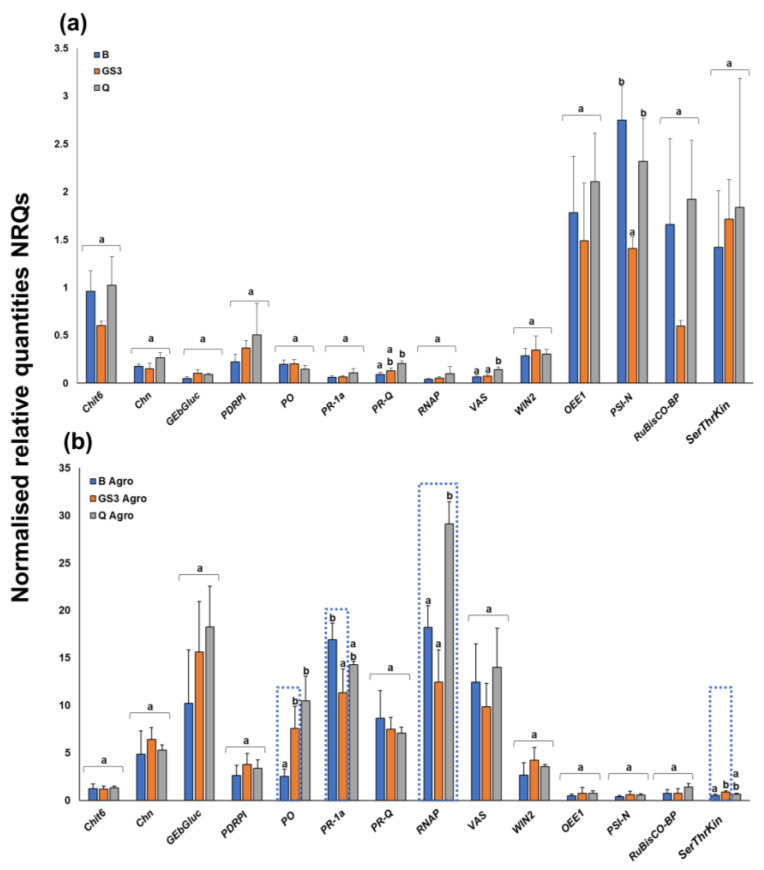
Figure 1.
Gene expression data expressed as normalised relative quantities (NRQs); (a) control samples and (b) agroinfiltrated samples. The error bars refer to the standard deviation calculated from three biological replicates. Different letters indicate statistically significant differences among groups (p-value < 0.05). The statistical parameters are indicated in Table S1. The dotted areas show the different expression values in the GS3- or Q-treated leaves as compared to B-treated samples. B: buffer; GS3: phyto-courier formulation containing 25 mg of quercetin; Q: quercetin; Agro: agroinfiltrated.

