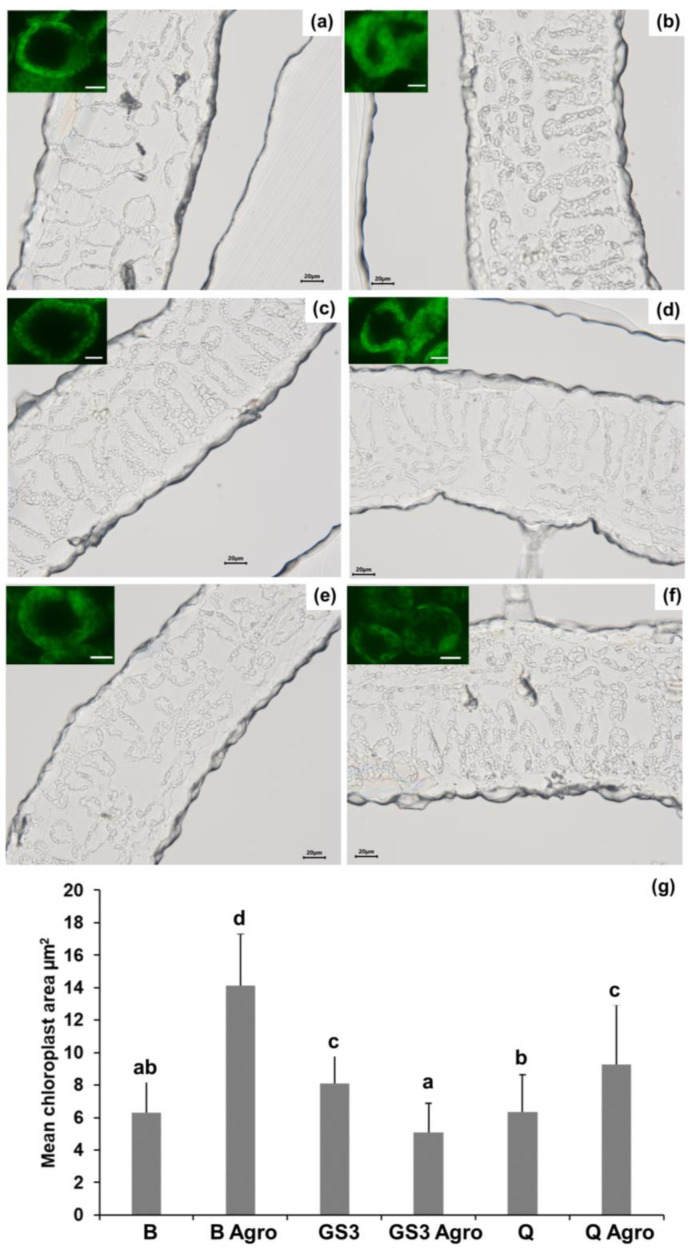
Figure 2.
Optical microscopy of the leaf parenchyma in control and stressed leaves; (a) buffer-primed, (b) buffer-primed and agroinfiltrated, (c) GS3-primed, (d) GS3-primed and agroinfiltrated, (e) Q-primed, (f) Q-primed and agroinfiltrated, (g) plot of the mean chloroplast area calculated on n = 40 with ImageJ. Different letters indicate statistically significant differences among groups (p-value < 0.05) determined with a Kruskal–Wallis test with Dunn’s post hoc test (X2(5) = 124.765, p-value = 0.000). Insets in (a–f): chloroplast autofluorescence (bar = 10 µm).

