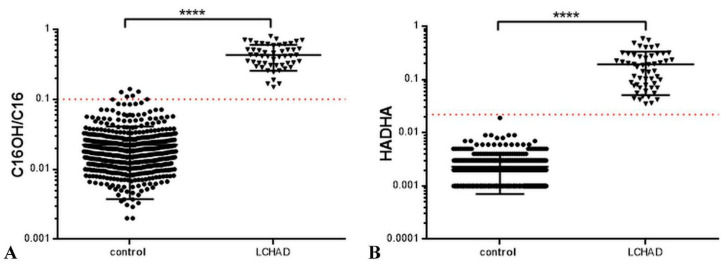
Figure 1.
(A) The ratio C16OH/C16 of the patients diagnosed with LCHAD deficiency and the control samples, **** p < 0.0001; (B) The “HADHA ratio” = (C16OH + C18OH + C18:1OH)/C0 of the patients diagnosed with LCHAD deficiencies and the control samples, **** p < 0.0001. Circles indicate control group subjects; triangles—LCHAD deficiency patients; red-pointed line—the cut-off value.

