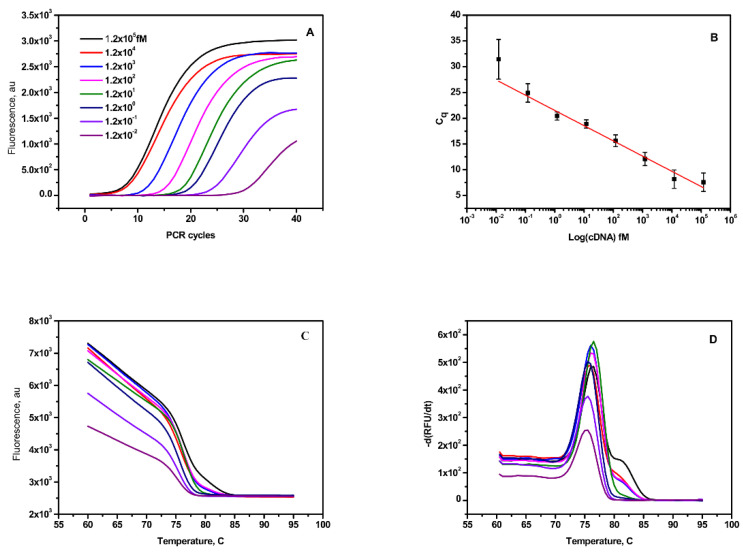
Figure 6.
Mir210 RT-qPCR assay. (A) PCR amplification plot of mir210 cDNA over seven orders of magnitude from 0.012 fM to 1.2 × 10⁵ fM. (B) Standard calibration curve of mir210 cDNA. (C) Melting curve of the amplified PCR product in the temperature range between 5 to 95 °C. (D) First derivative of the melting curve. The Tm of the products is close to 75.5 ± 1.5 °C.

