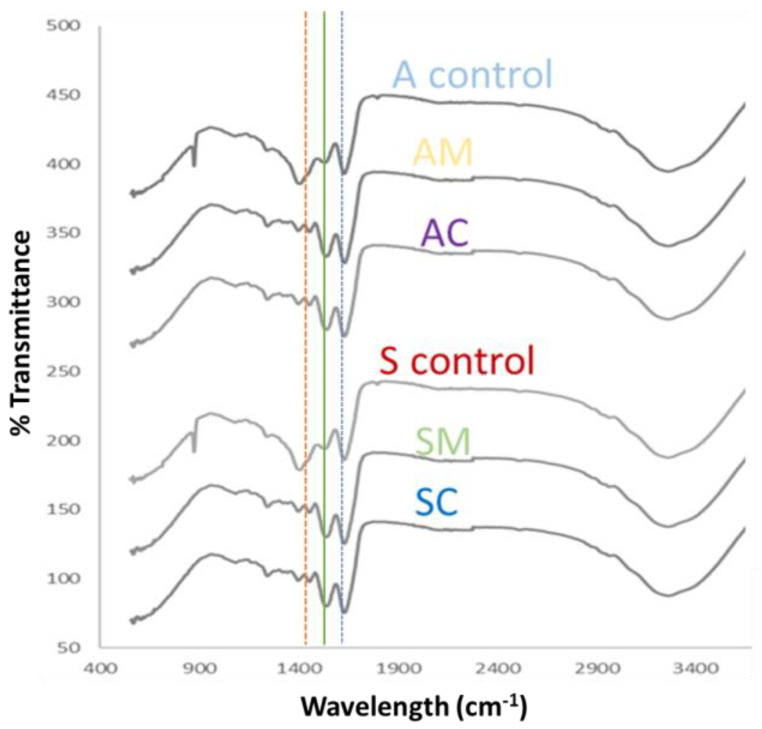
Figure 3.
FTIR spectra of blank extracted eggshell membrane, i.e., A control and S control (unmodified ESM samples) and modified ESM samples i.e., AC, AM, SC, and SM (see abbreviation table for full details of samples). Green and blue coloured lines correspond to 1620 cm−1 and 1520 cm−1 bands, respectively. The orange line is associated with the 1400 cm−1 band that suggests the presence of AgNPs and their interaction with the ESM by deformations in the C-H bond.

