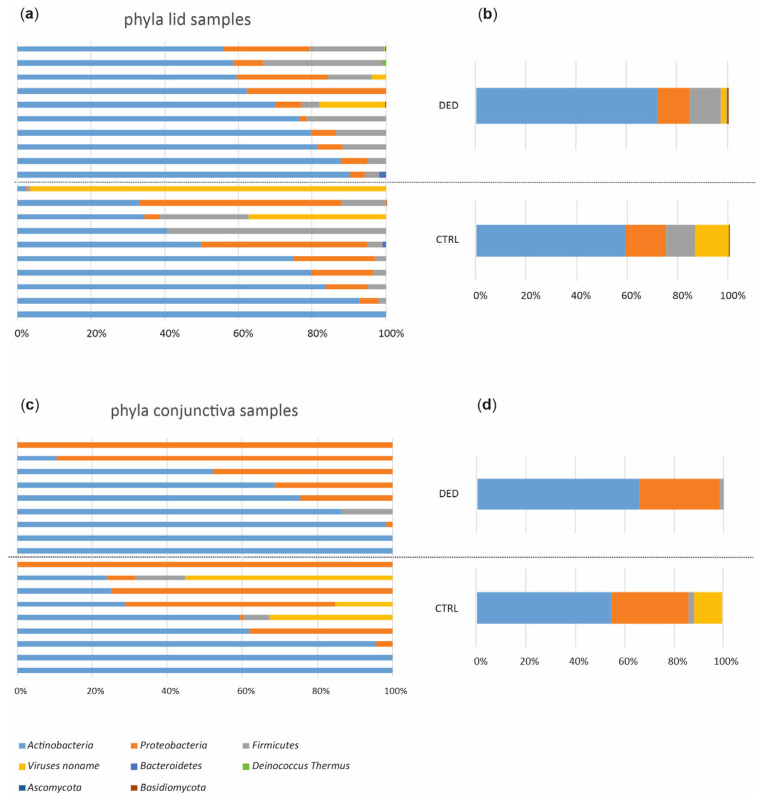
Figure 3.
Taxonomic characterization of the ocular surface microbiome. Relative microbiota abundances at the phylum level from lid samples in all study subjects (a) and averaged for study groups (b). Relative microbiota abundances at the phylum level from conjunctival samples in all study subjects (c) and averaged for study groups (d). CTRL, control (n = 10); DED, dry eye disease (n = 10).

