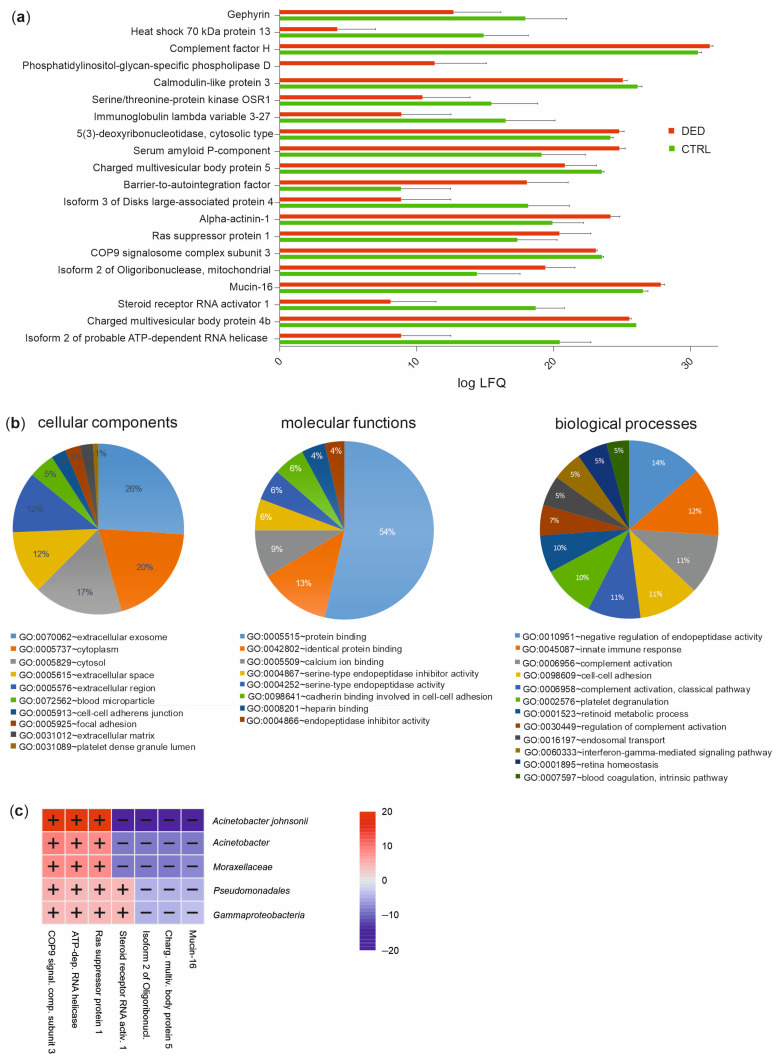
Figure 5.
Distinct tear proteome between DED patients and healthy controls. (a) Label-free quantification (LFQ) values of the top 20 tear proteins between DED patients and controls. The mean of log10 values and standard deviations are shown. CTRL, control (n = 10); DED, dry eye disease (n = 10). (b) Functional classification of the significantly different tear proteins in DED patients compared to controls based on the Gene Ontology (GO) categories cellular components, molecular functions, and biological processes (DAVID bioinformatics tool). (c) Significant associations between taxonomic features of the ocular surface microbiome and the top 20 significantly different tear proteins between DED patients and controls (−log(qval)×ign(coeff), MaAsLin2).

