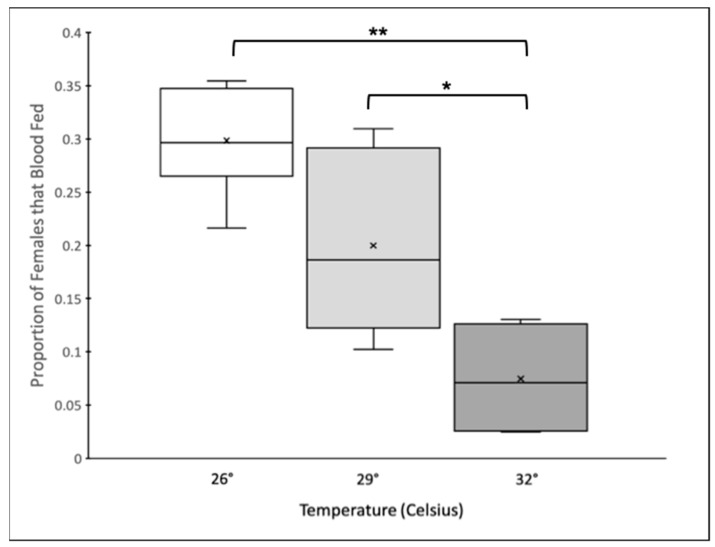
Figure 1.
Box and Whisker plot of the proportion of females that blood fed within an individual cage across temperature treatments. The center line indicates the median (50th percentile), the boxes contain the 25th to 75th percentiles, and the ×s represent the mean. Boxplots connected by brackets and asterisks indicate pairwise comparisons between means that are significantly different (* = p < 0.01, ** = p < 0.001).

