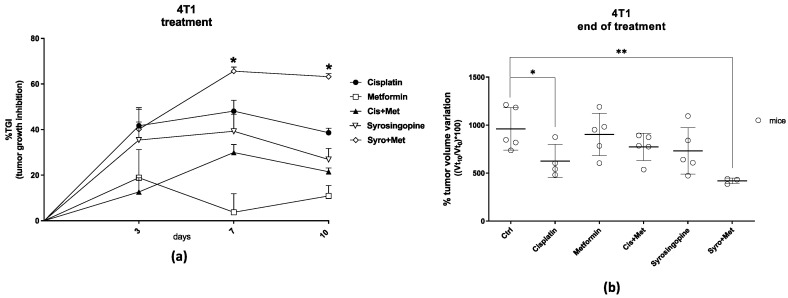
Figure 1.
Treatment efficacy results on TNBC model (4T1 cell line), expressed as (a) percentage of tumor growth inhibition (%TGI) compared to the control group, calculated at different time points. Mice were randomly assigned to six groups of treatment: control (n. 5), cisplatin (n. 4, dose of 3 mg/kg i.p., twice a week), MET (n. 5, dose of 250 mg/kg i.p., daily), cisplatin plus MET (n. 5), SYRO (n. 5, dose of 7.5 mg/kg i.p., three times per week), and SYRO plus MET (n. 3). Average values calculated per group ± SEM; * (tumor growth inhibition > 52% is considered meaningful). Data at the end of treatment (10 days) were even expressed as (b) percentage of tumor volume variation compared to the start of treatment. Average values calculated per group ± SD (Student’s t-test; * p < 0.05 and ** p < 0.01 vs. vehicle group).

